|
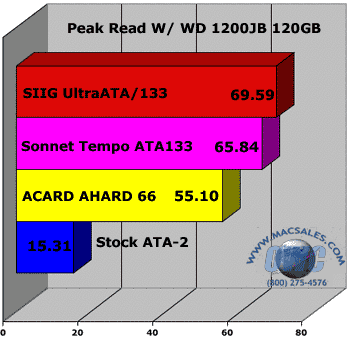
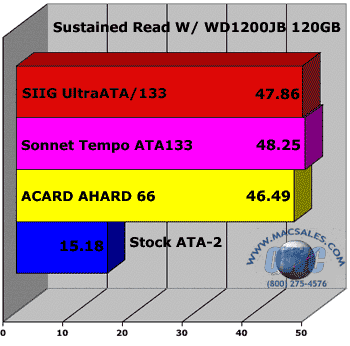
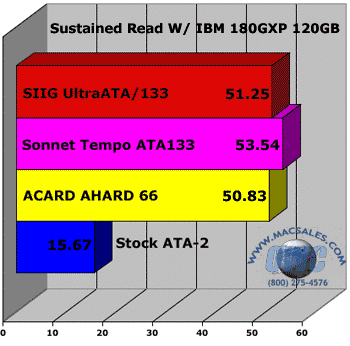
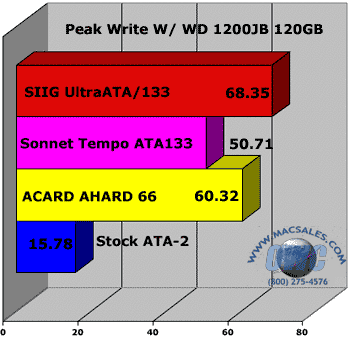
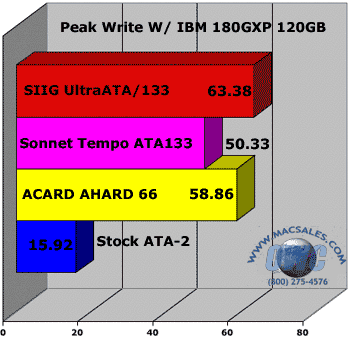
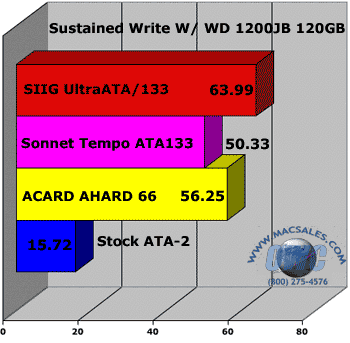
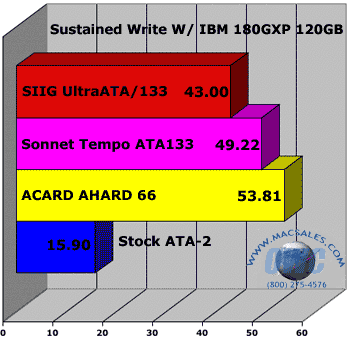
This page contains the same information as the following page does, except the data has been formulated into graphs instead of screenshots of the actual performance figures. I highly recommend you view that page also as it is revealing to see the raw data instead of just the final figures. When testing hard drives, it's always nice to see a flat line in the drive performance data, instead of a jagged line. A flat line means the drive is very consistent in it's read and write performance, whereas the jagged line indicates slower performance (usually), and sometimes even more ambient noise.
|