Free shipping available on orders $99 & up!
  • Business Icon For Business & More icon arrow
    • Creative, Production & PostCreative, Production & Post
    • Corporate & EnterpriseCorporate & Enterprise
    • Higher EducationHigher Education
    • State, Local & K-12 EducationState, Local & K-12 Education
    • House of WorshipHouse of Worship
    • Systems IntegratorSystems Integrator
    • HealthcareHealthcare
    • Federal, State & Local GovernmentFederal, State & Local Government
    • Join Today!

      Already registered? Sign In

  • Region: US/Intl icon arrow
    • Select your preferredcountry / region:

    • USA RegionUSA + International
    • Canada RegionOWC Canada

    • Experience local shipping options and optimized product inventory for your region.

  • Phone Icon1-800-275-4576
  • Intl: 1-815-338-8685
MacSales.com Powered By OWC
  • Blog
  • Support
  • Account
    • Hello, Sign In
    • My Account
    • Order Status
    • Write A Review
    • Warranty & Returns
  • Cart
MacSales.com Powered By OWC
  • Support
  • Chat Contact
  • Account
    • Hello, Sign In
    • My Account
    • Order Status
    • Write A Review
    • Warranty & Returns
  • Cart
  • Specials & Featured
  • Rocket Yard Blog
  • Chat
  • Support
      • Shop All
        • Internal Drives
        • External Drives
        • Apple & Macs
        • Docks & Connectivity
        • Cards & Readers
        • Batteries
        • Software & Apps
        • Cables & Adapters
        • Memory
        • PCIe Expansion
        • Specials & Featured
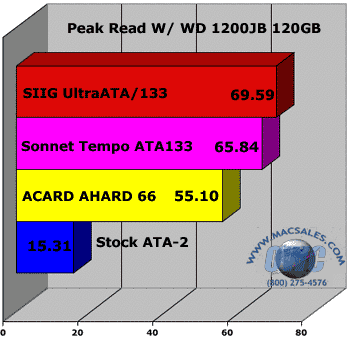
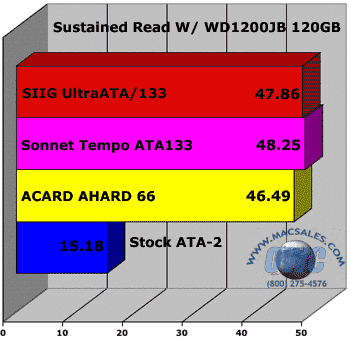
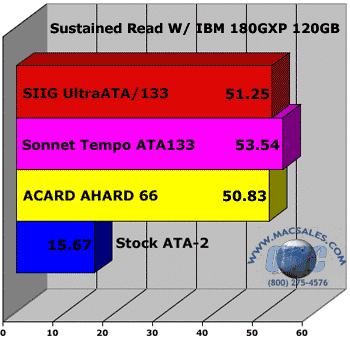
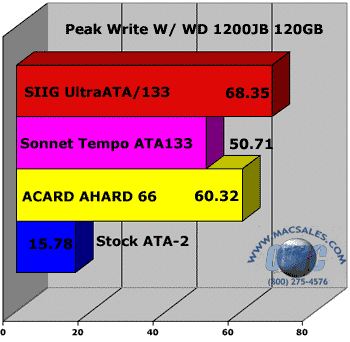
        This page contains the same information as the following page does, except the data has been formulated into graphs instead of screenshots of the actual performance figures. I highly recommend you view that page also as it is revealing to see the raw data instead of just the final figures. When testing hard drives, it's always nice to see a flat line in the drive performance data, instead of a jagged line. A flat line means the drive is very consistent in it's read and write performance, whereas the jagged line indicates slower performance (usually), and sometimes even more ambient noise.
        Peak Read Tests. Longer bars are better

        Sustained Read Tests. Longer bars are better

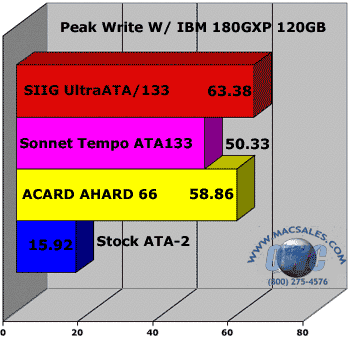
        Peak Write Tests. Longer bars are better

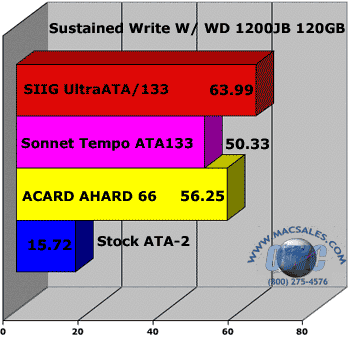
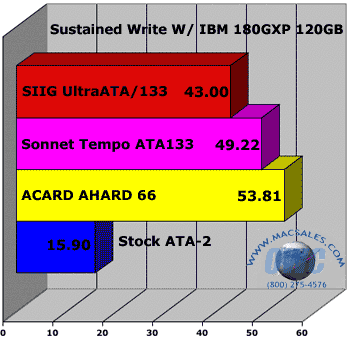
        Sustained Write Tests. Longer bars are better
        The above tests were performed using ATTO's Macintosh Express-Pro tools version 2.81. Disk cache levels were set to 8MB, and 2 samples were run. This test shows the maximum and sustained read and write speeds. This is an excellent benchmark test to show what drive & controller card give the ultimate performance boost to the Beige G3 system. Note that the drives, when paired with the right controller, could sustain in excess of 50MB per second.
        That's awesome performance!

        Click to read Page 3 - ATTO Express Pro-Tools Benchmark Screenshots & Graphs

        or, skip to page 4 if you don't want to see the raw data - MacBench 5 Testing

        Helpful Links
        • About Us
        • DIY Install Videos
        • Join our Affiliate Network
        • Where to Buy
        • Accessibility Statement
        • Sustainability is Good Business
        • Join the OWC Team
        • Media+Newsroom
        • Privacy Promise
        • MacSales.com for Business
        Join the OWC Newsletter

        Join hundreds-of-thousands of tech enthusiasts across the planet and gain access to specials, clearance, and holiday savings on the OWC upgrades, drives, and docks everyone loves.

        • bbb
        © 2000-2026 Other World Computing, Inc., All Rights Reserved. Site Terms Guest ID:
        Your Privacy Choices
        This item has been added to your cart