Activity Monitor is one of my favorite apps, although when my Mac is running as it should, I hardly ever use it. But when there’s a need to troubleshoot problems, check performance, or see if an upgrade, such as additional RAM or a larger and faster drive, would be beneficial, Activity Monitor is the app I use first.
It can be such a useful app that I have it set to start automatically whenever I start up my Mac. It sits in my Dock and displays a small graph showing CPU performance over time. That’s just one of many informational graphs Activity Monitor can generate; you may find one of the other Dock views a better fit for your needs. More on that later in this article.
In part 1 of this Rocket Yard guide, we’ll look at using Activity Monitor to gauge the performance of the Mac’s processors and memory systems.
What is Activity Monitor?
At its heart, the Activity Monitor app is designed to show all the processes that are running on your Mac and how those processes are affecting your Mac’s hardware. Some consider Activity Monitor to be similar to Windows Task Manager. Both allow you to see which apps and processes are currently running. You can kill or quit a process that may be causing problems, such as a frozen app or one that’s hogging significant resources.
Activity Monitor also lets you see how each process or app is affecting your Mac’s CPU, RAM, energy, disk, and network usage. You can think of the app as letting you see what’s going on behind your Mac’s desktop.
Launching Activity Monitor
You can start Activity Monitor up when you have a specific need to troubleshoot issues or check on performance, or you can launch Activity Monitor as part of the startup process for your Mac.
Launch Activity Monitor, located at /Applications/Utilities.
The Activity Monitor window will open, and its icon will be added to the Dock.
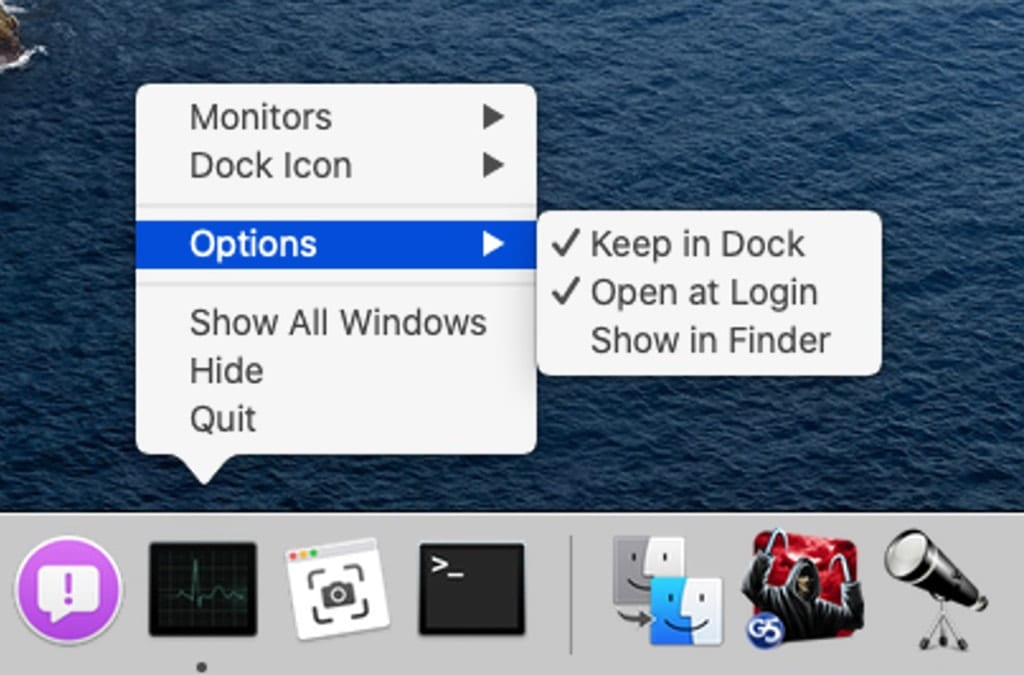
To have Activity Monitor automatically launch whenever you start your Mac up, right-click the Activity Monitor dock icon and select Options, Open at Login.
The Activity Monitor app will now open automatically whenever you start up your Mac.
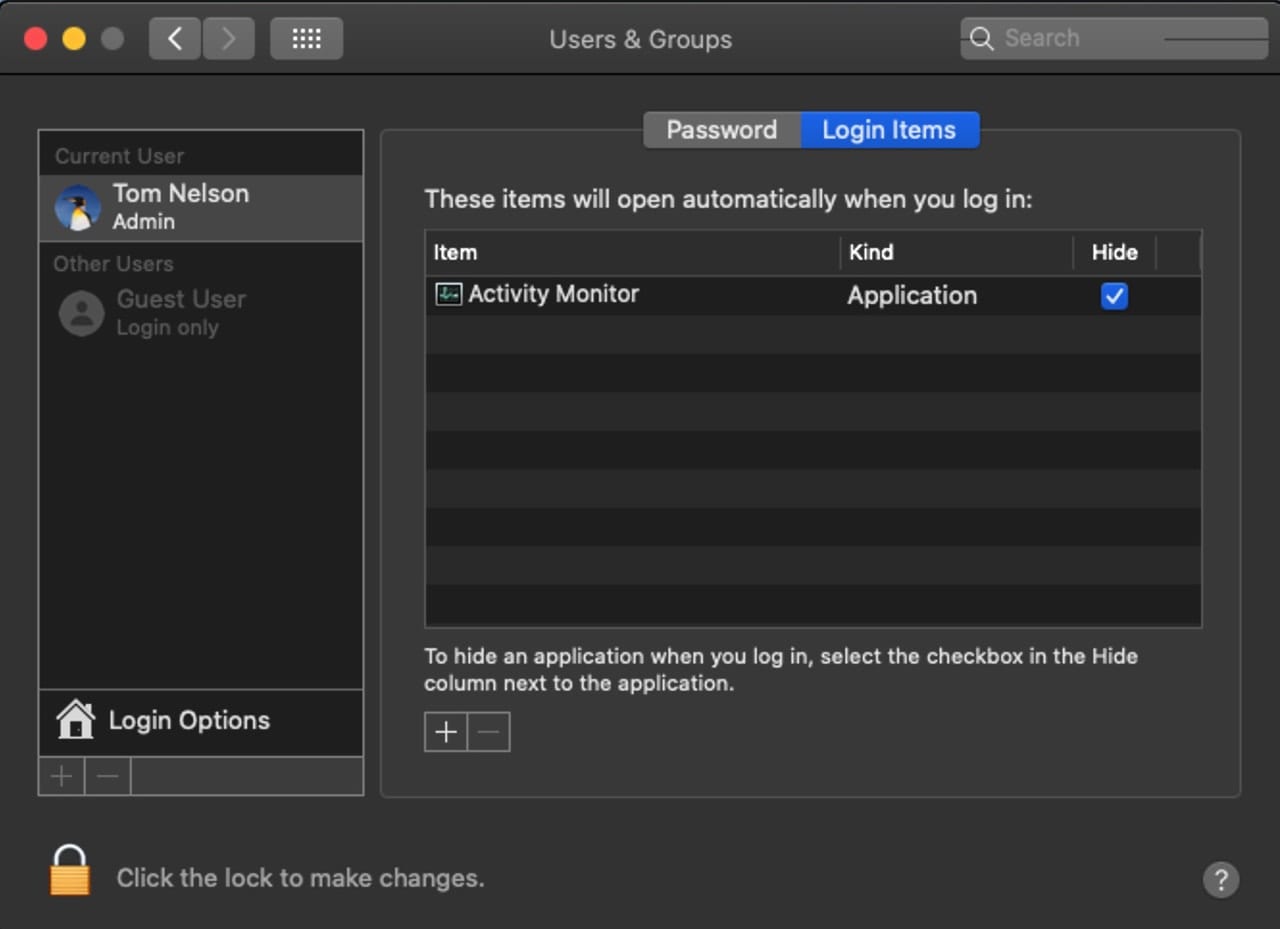
Tip: To have Activity Monitor automatically start up at login but leave the Activity Window closed so it doesn’t clutter up your desktop, do the following:
Launch System Preferences, and select the Users & Groups preference pane.
Select your user account from the sidebar, and then click the Login Items tab.
Place a check mark in the Hide box, next to the Activity Monitor item.
Now for the super secret step: Quit the Activity Monitor app before you shut down or restart your Mac. You only need to do this once; after that, each time your Mac starts up, Activity Monitor will be running without its window. Should you need to see the Activity Monitor window, you can view it by clicking on Activity Monitor’s Dock icon.
Activity Monitor Overview
Activity Monitor can show you all of the processes running on your Mac, including user apps, system apps, and background processes that may normally be invisible to the user. By default, Activity Monitor will show you processes and apps that were started by you. You can change which type of processes are displayed by accessing the Activity Monitor View menu. There’s a wide range of choices that you can try out for yourself. When you’re done, set the View option back to My Processes for the rest of this guide.
Activity Monitor displays the effects of each process on your Mac’s hardware. Because that’s a lot of information to present, Activity Monitor breaks it into 5 categories you’ll find shown as tabs at the top of the app’s window. The five tabs are:
- CPU: Shows how the processes are affecting your Mac’s processors, including the CPU and GPU.
- Memory: Displays how the processes are using memory.
- Energy: Shows how much energy is being used and how much each process is using on its own.
- Disk: Displays how much data a process has written to or read from a drive.
- Network: Shows how much data each app or process is sending or receiving over the network.
Note: There can be a sixth tab, labeled Cache, if you have set up local Content Caching. Most users won’t see this additional tab, and we won’t be covering it in this guide.
CPU
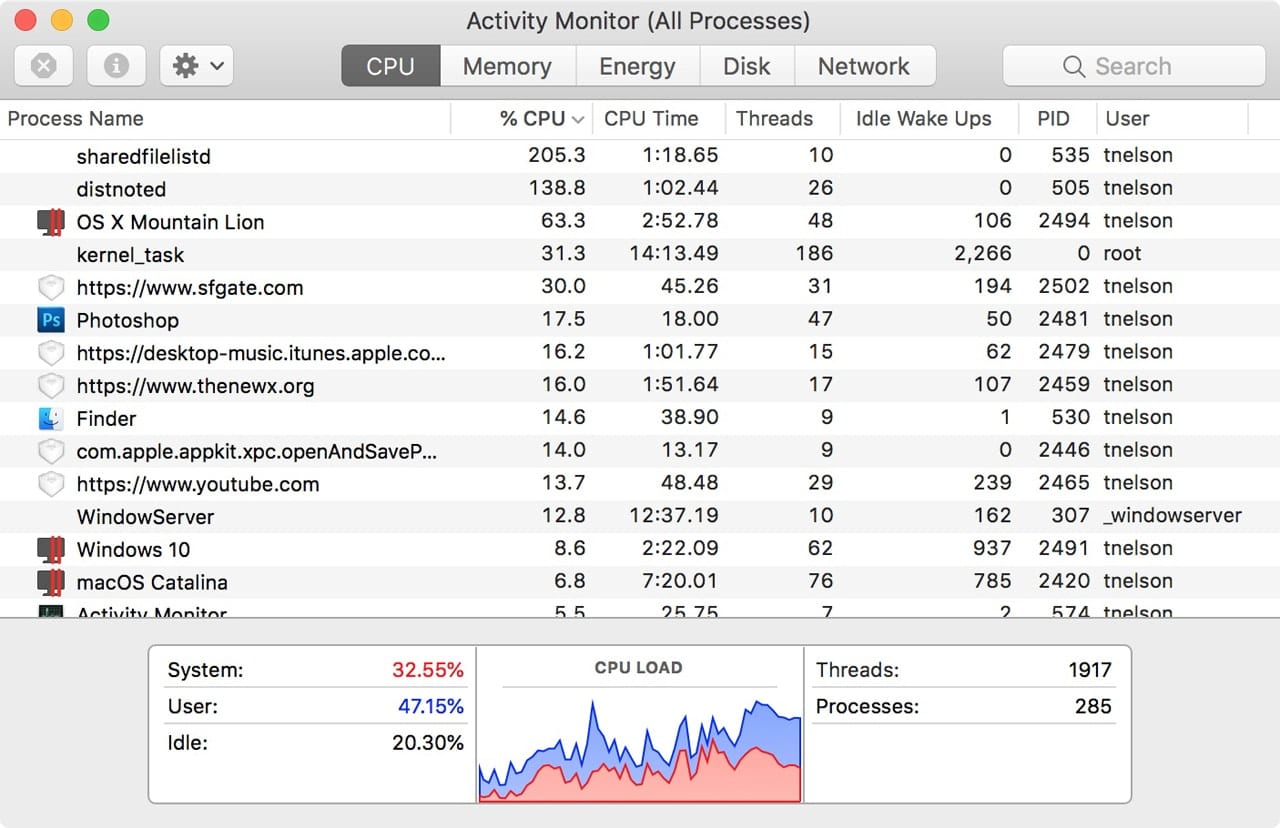
This tab displays how each process is using your Mac’s processor resources, including the following:
- % CPU: The percentage of CPU capacity used by each process.
- CPU Time: The amount of CPU time used by a process.
- Threads: How many active threads a process is currently running. Threads are small chunks of the application that can be run concurrently.
- Idle Wake Ups: This is the number of times a thread has forced the Mac to wake up from an idle state.
- % GPU: Percentage of the Mac’s GPU the process is using.
- GPU Time: The amount of time the GPU is used by the process.
- PID: A unique identification number assigned to each process.
- User: The owner of the process. This is usually whoever started the process.
Additionally, at the bottom of the CPU views are totals for all processes:
- System: Percentage of time the CPU is used by the system.
- User: Percentage of time the CPU is in use by the user.
- Idle: The percentage of time the CPU is idle, not performing any tasks.
- CPU Load: This is a graph showing CPU usage over time.
- Threads: Total threads from all processes currently running on the CPU.
- Processes: Total number of processes actively running on the Mac’s CPU.
The information in the CPU tab can be used to identify processes that may be affecting the Mac’s performance by hogging available resources. It’s not uncommon for a poorly behaving app to suck up most of the processor resources, or to have a GPU spending all its time on a single process.
Identifying which apps are causing the problems can be helpful in devising a plan to remedy the issue.
The CPU Load graph can be very helpful as it shows overall CPU use over time, unlike each process item in the CPU list, which only shows current values. Sometimes, by the time you investigate a CPU issue, the process causing the problem has already completed its task, leaving you to wonder why everything looks OK. When that happens, check the CPU Load graph to spot resource issues that occurred in the recent past.
Most Macs don’t have user replaceable CPUs, leaving most of us with few options to increase performance beyond upgrading to a newer and faster Mac. But if the issue is with the GPU being bogged down, you may want to consider adding an external GPU unit to offload some computational load from the internal processors, as well as experience impressive performance increases in some apps.
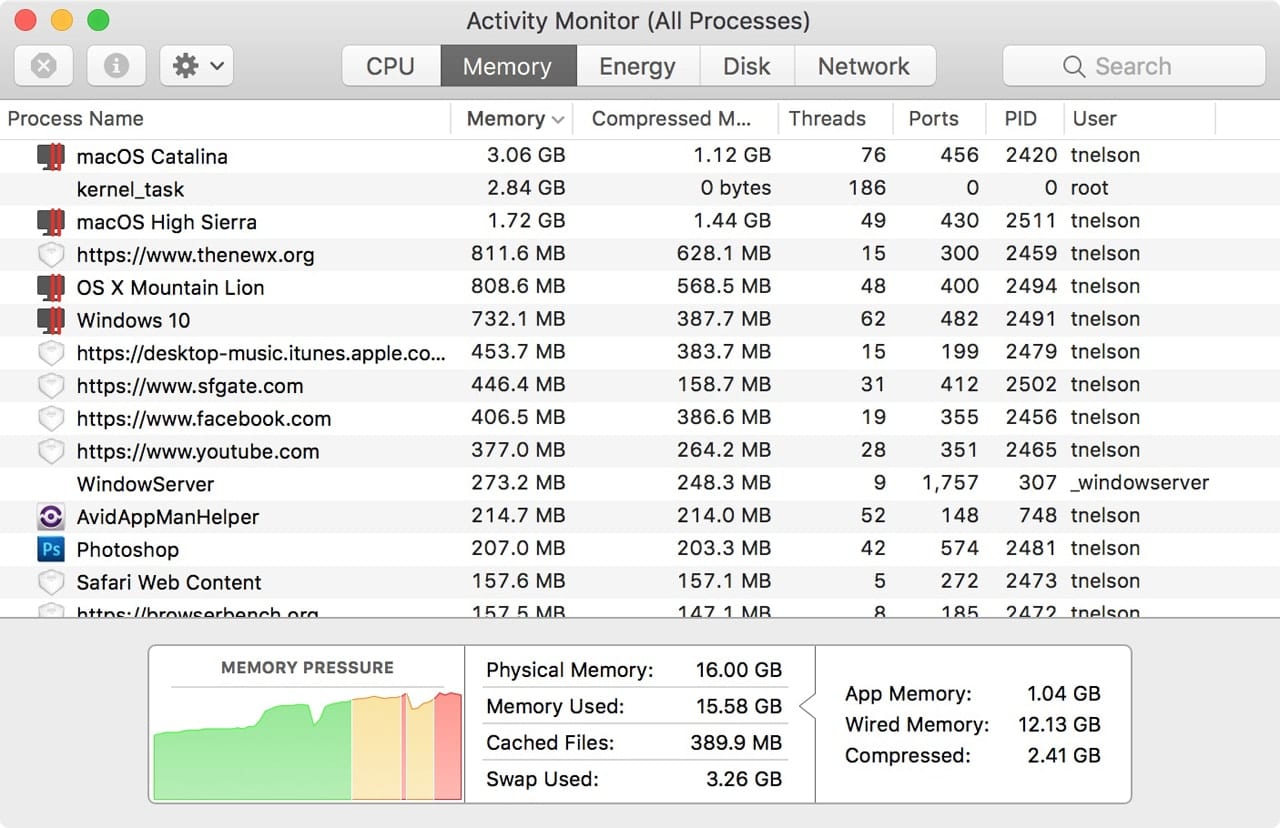
Memory
The Memory tab displays how each process is making use of your Mac’s RAM:
- Memory: The amount of RAM used by the process.
- Compressed: This is a memory management feature that compresses information not currently actively being used, but which may be used later by the app.
- Threads:How many active threads an app has running. Each thread requires additional RAM, but also increases performance of the app.
- Ports: The number of ports (inter-process communications) opened by a process.
- PID: Unique identification number for the process.
- User: The owner of the process.
At the bottom of the Memory tab are totals for all processes:
- Memory Pressure: A graph showing the need to compress memory over time.
- Physical Memory: Total amount of RAM installed in your Mac.
- Memory Used: Total amount of memory currently in use.
- Cached Files: Memory that was recently in use, but is now marked as available for use by other apps.
- Swap Used: The amount of data moved from RAM to disk because of insufficient memory space.
- App Memory: The total amount of RAM used by apps.
- Wired Memory: Memory that can’t be compressed or paged out.
- Compressed: The total amount of memory currently compressed.
The information in the Memory tab can be used to discover which apps are memory hogs, or apps that may have memory leaks that are continuing to consume memory.
The memory tab is also handy in helping to determine if you need additional RAM. If your total RAM usage is high, you have a lot of compressed memory, or you have excessive swapping to disk, your Mac would likely benefit from additional RAM.
Activity Monitor Graphs
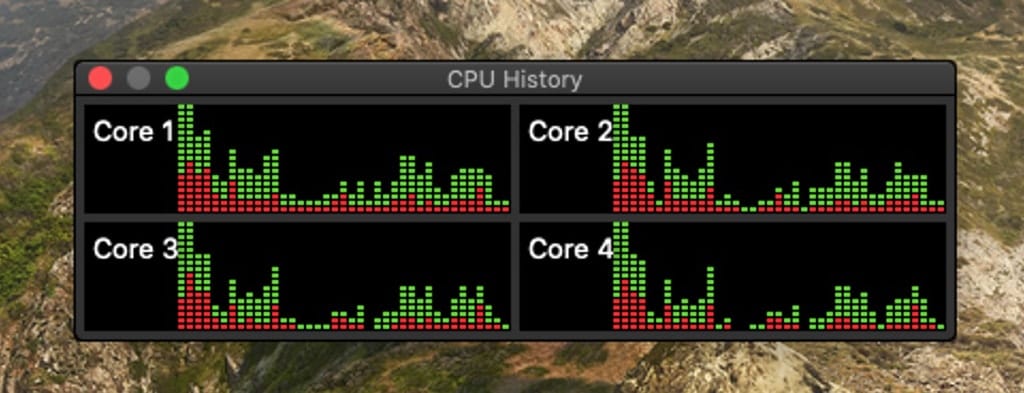
Activity Monitor has a number of near real-time graphs that can be used to monitor your Mac’s overall performance. The graphs can be displayed as individual mini windows you can place on your Desktop, or the Activity Monitor’s Dock icon can have one of the graphs superimposed over its icon.
You can even combine the two methods of display so you can view multiple graphs at the same time.
To access a graph as a window, select Window, CPU Usage, or Window, CPU History from the Activity Monitor menus. You can also activate the window graphs by right-clicking on the Activity Monitor Dock icon and selecting Monitors, Show CPU Usage or Monitors, Show CPU History.
The Dock icon has a few additional types of resource graphs you can display. You can pick a graph for the Dock icon by right-clicking the Activity Monitor Dock icon and selecting Dock Icon, CPU usage, CPU History, Disk Activity, or Network Usage from the popup menu.
Absent from any Activity Monitor graph is one for displaying memory usage, though a Memory Pressure graphic is available from the Memory tab. If you would like to see a memory use graph, there are a number of third-party utilities that can display this type of information.
What’s Coming Up in Using Activity Monitor: Part 2
In our next installment, we will cover the three remaining Activity Monitor tabs – Energy, Disk, and Network – along with using Activity Monitor to quit or force quit running processes, and using Activity Monitor’s built-in diagnostics to help in troubleshooting issues with the Mac.







These are just descriptions.
What’s severely lacking here is the implications of the numbers, like benchmarks of what’s good and bad.
Otherwise, the descriptions frankly means nothing.
Part 1 seems like a basic rundown of Activity Monitor, but would like more detailed information on each one. Maybe that is coming up in future installments. Much needed info for anyone not familiar with AM.
How do I find app running even with all apps closedMalcolm
Thanks for the brief breakdown of the Activity Monitor, I use the built in App a few times every week to diagnose issues. Looking forward to your follow -up. Thanks