

A few weeks ago I regaled you with a set of Little Known macOS System Preferences. Every Mac also comes with a variety of apps that many people don’t know about, so today I’ll shed some light on six of these little known Mac apps.
Let’s go!
1. Activity Monitor
Some Macs don’t have cooling fans, but for those that do, the users often wonder why the fan is running at full speed! Activity Monitor is a useful utility displaying information about the apps and system processes currently running on your Mac. To launch the app, open your Applications folder, then the Utilities folder, and you’ll find Activity Monitor.
Once launched, you’ll see something similar to the screenshot below:
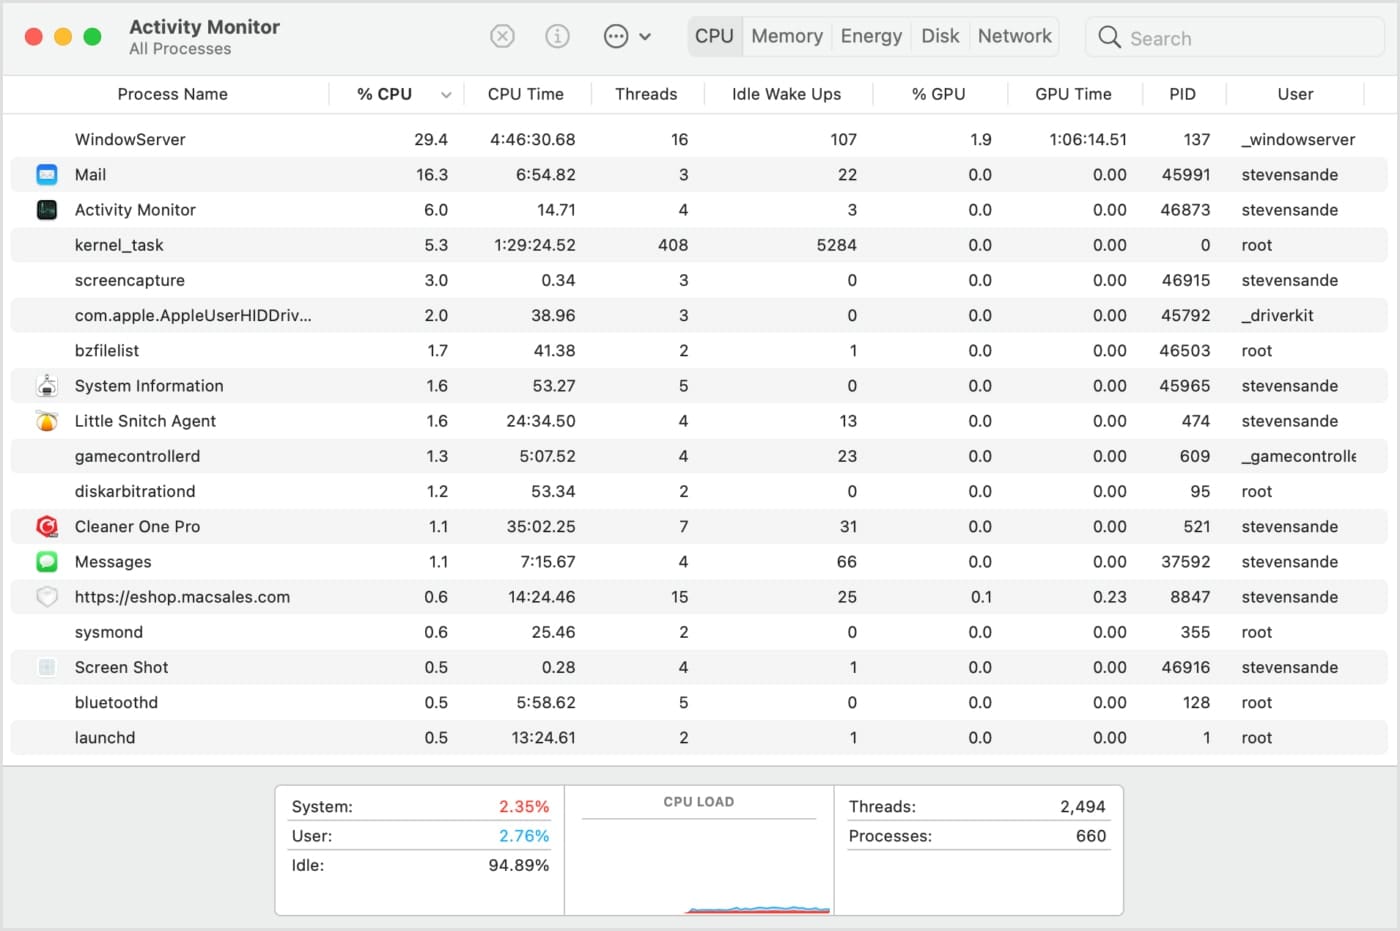
At the top of the Activity Monitor window are five tabs: CPU, Memory, Energy, Disk, and Network. CPU shows the different processes running, how much CPU they’re each using, the amount of time they’ve been running (hours:minutes:seconds), and the number of threads running. The percentage of GPU (graphic processor unit) capability used by each process is listed, as well as how long the GPU has been used.
In this example screenshot, you see obvious apps like Mail and Messages. There are other processes like sysmond (system monitor daemon), bluetoothd (Bluetooth daemon), and so on; these are mostly background processes that run all the time.
The Memory Tab
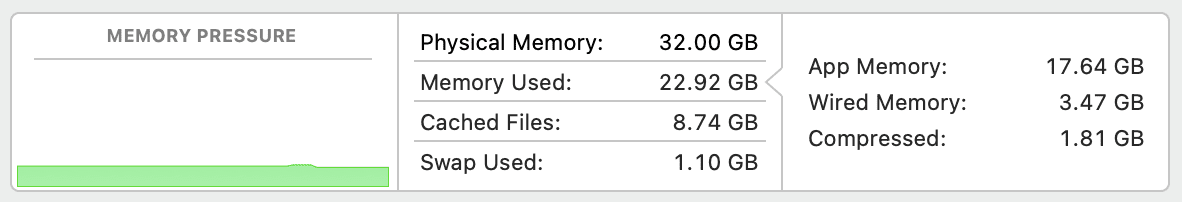
The Memory tab shows how much RAM is being used at any time. One of the more helpful features is found at the bottom of the Memory tab. It’s a chart showing “Memory Pressure” (see screenshot below). What’s that? Well, if your Mac is running slow, it might not have enough RAM installed and is swapping out items in memory to your disk. Here you can see that my MacBook Pro with 32GB of RAM is in the “green” on the left. That means it’s not really overusing RAM. If the chart was showing red quite often, it’s an indication you should consider a RAM upgrade.
The Energy Tab
The Energy tab is helpful for those who want to stretch a MacBook battery charge as long as possible. It shows the energy impact of each app and process, whether or not it can take an “app nap” to conserve energy, if it uses the GPU, and if it is preventing your Mac from sleeping.
The Disk Tab
Your startup drive is the focus of the Disk tab. This tab shows how often a process or app reads and writes to a disk. An app that is constantly writing to or reading from storage can slow down a Mac. Should this be the case on your Mac, look into an internal disk upgrade from OWC.
Macs using an external drive as a boot drive can benefit from using a fast Thunderbolt drive.
The Network Tab
The last tab we’ll look at is the Network tab. This displays what each process and app is doing in terms of sending and receiving data over a network, measured in both bytes and packets. This information is useful when doing things like video streaming (you might be overtaxing your network) or if you see an unknown process that is sending and receiving a lot of data. That latter situation may indicate malware that is sending data from your Mac to an unknown recipient.
Other Windows in Activity Monitor
The Window menu in Activity Monitor is your gateway to some other useful displays. For example, Window > CPU Usage displays a chart showing just how hard each core in your CPU is working:
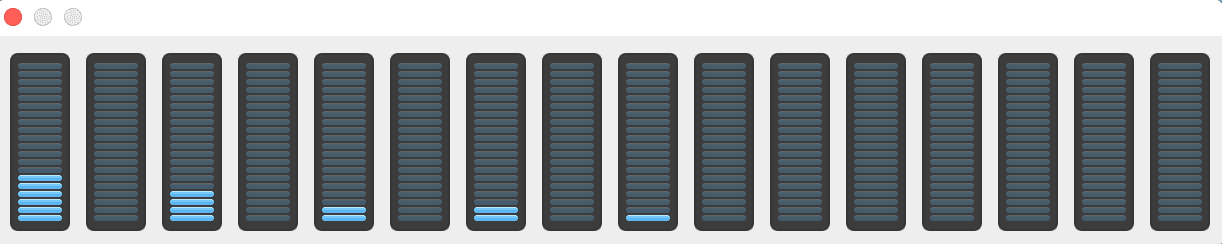
There’s also Window > CPU History, which displays the same information in a constantly updating bar chart. It shows how each core has been used over time.
Finally, Window > GPU History displays a similar bar chart for each GPU in your computer. My MacBook uses both an Intel UHD Graphics 630, which is part of the i9 chipset, and an AMD Radeon Pro 5500M. I found it interesting that GPU History showed very little activity on both GPUs until I fired up YouTube in a browser window. Even then, the GPU wasn’t breathing hard.
For more information this little known Mac app, visit Apple’s User Guide for Activity Monitor.
2. Chess
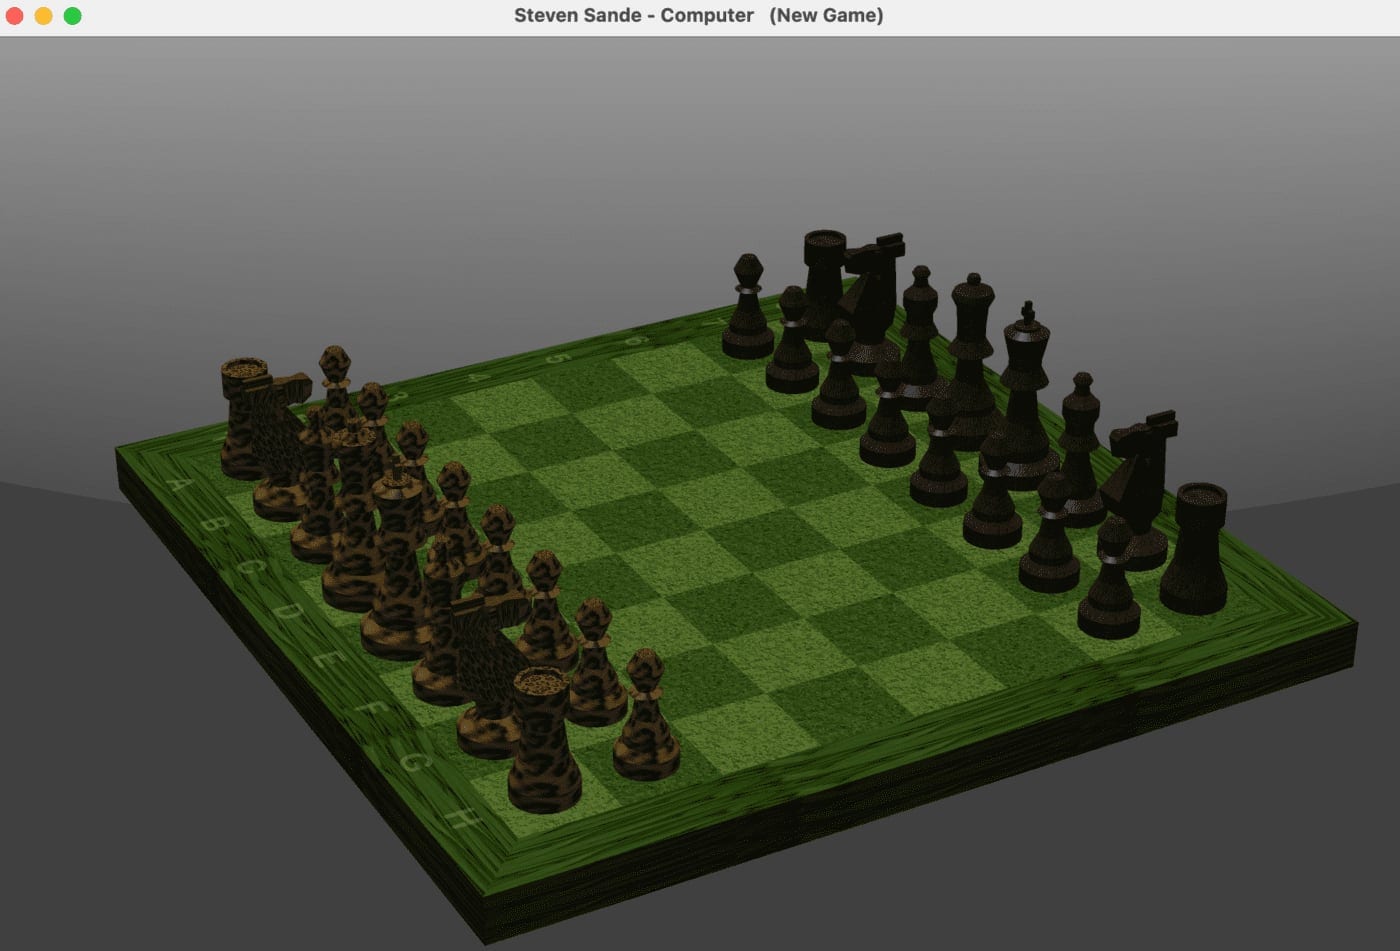
Enough of the boring charts and graphs – let’s play a game! Chess has been a Mac staple for many years. It’s a 3D representation of a chessboard, and the app gives you the option of playing a match online using Apple’s Game Center, against the computer, or against yourself. As you’d expect, it is found in the Applications folder along with the other little known Mac apps.
By default, you’re playing on a wooden chessboard with wooden pieces, but selecting Chess > Preferences gives you choices of having the board and pieces made of other materials – marble, metal, and grass for the board, and marble, metal, and fur for the pieces!
Don’t want to use your mouse or trackpad to move the pieces? Another preference lets you speak moves – for example, “Pawn e2 to e4.” If you’re new to chess, you can set the level of difficulty toward “faster” to make a game against the computer much easier to win or set it to “stronger” to make a game harder to win.
The board is also movable. Clicking and dragging a corner of the board makes it possible to view it from any side, from above, or at an angle. The Chess user guide on the Apple Support website has more details for this app.
3. Font Book
Back in the days when font management became a big deal (the 1990s, for example), there were many commercial apps to let Mac owners see what various typefaces looked like. With the advent of OS X and macOS came a lot of free fonts and a tool to manage them with – Font Book.
Font Book is accessible from the Applications folder. Launching it displays a list of fonts, both those that are already downloaded and installed on your Mac as well as fonts that can be downloaded with a click. In the screenshot below, you’ll notice that some of the fonts are listed in black while others are gray — the gray ones are available but not downloaded, while the black fonts are on your Mac.
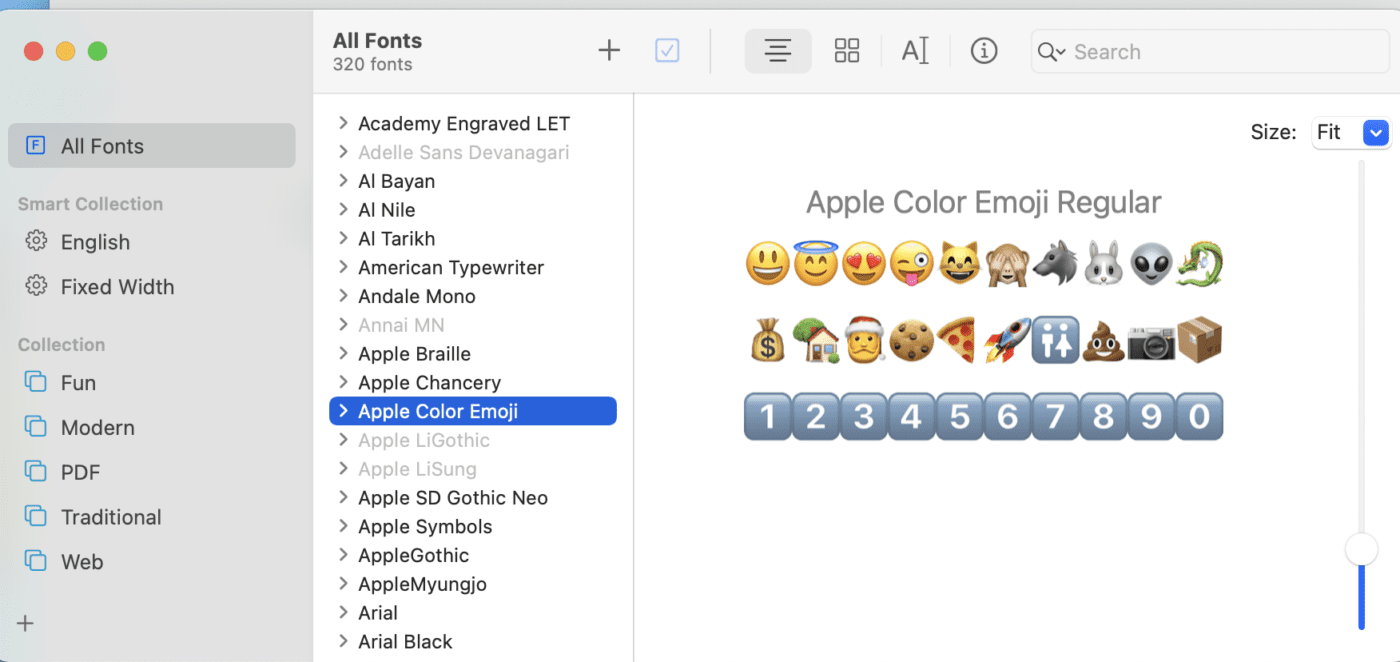
For me, I’d say there is little or no chance that I’m ever going to use the Arabic fonts (Al Bayan, Al Nile, and Al Tarikh), Asian fonts (Apple Myungjo, Heiti SC Light, etc…), Indian fonts (ITF Devanagari Book), etc… However, Apple apparently thinks that our Macs do have unlimited storage, so they’ve made it impossible to remove fonts in Font Book. You can add them, but there’s no way to delete them.
Finding New Fonts in Font Book
Font Book is useful for finding new fonts that you might wish to use. For example, I was pleased to find a really cool font called Trattatello that is perfect for anyone who needs an antique-looking typeface. The size slider at the right side of each font display lets you scale the letters up and down, and for many fonts (Helvetica Neue is a perfect example), clicking the disclosure caret (>) on the left of the font name gives you a choice of font weights and styles.
Helvetica Neue comes in the following weights and styles:
- Regular
- Italic
- Ultralight
- Ultralight Italic
- Thin
- Thin Italic
- Light
- Light Italic
- Medium
- Medium Italic
- Bold
- Bold Italic
- Condensed Bold
- Condensed Black
Talk about choice! Some apps install their own special fonts; other fonts that you might purchase or download appear in Font Book once they’ve been installed. For additional background on Font Book, check out this Support article.
4. Digital Color Meter
Have you ever found a color on a web page that you absolutely love? There’s a way to determine what that color is through the Digital Color Meter app. Digital Color Meter is located in “Applications > Utilities.” When launched, there’s not much of a user interface:
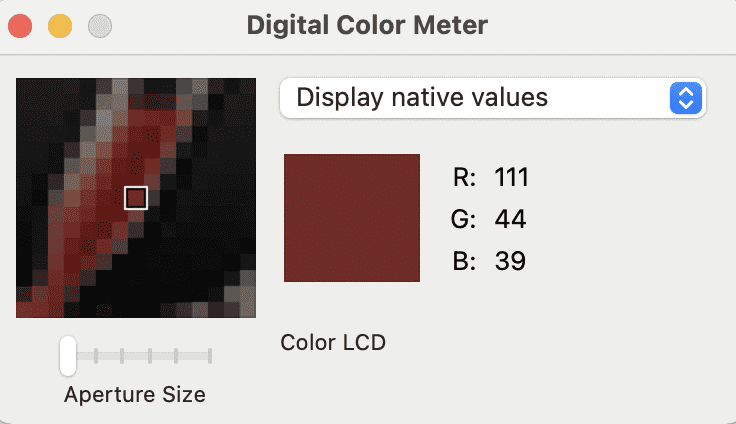
The big “Square” on the left side of the Digital Color Meter UI displays a magnified image of what’s directly underneath the cursor. Point the cursor tip at the color you want more information about and it appears in the smaller square. Next to it are the RGB (red, green, blue) values for that color.
The menu that says “Display native values” shows other color spaces when clicked. For example, you can also see the color values in P3, sRGB, Generic RGB, Adobe RGB, and L*a*b. Those values are useful when “mixing” a color to your specs. That maroon color above? Many Mac apps let you select the RGB values to mix a color — just insert them from Digital Color Meter for an exact match.
5. Voice Memos
Many people know that they can record Voice Memos on an iPhone, but did you know the app has a companion on the Mac? Voice Memos is iCloud-enabled, so any voice note recorded on an iPhone appears on your Mac and vice-versa.
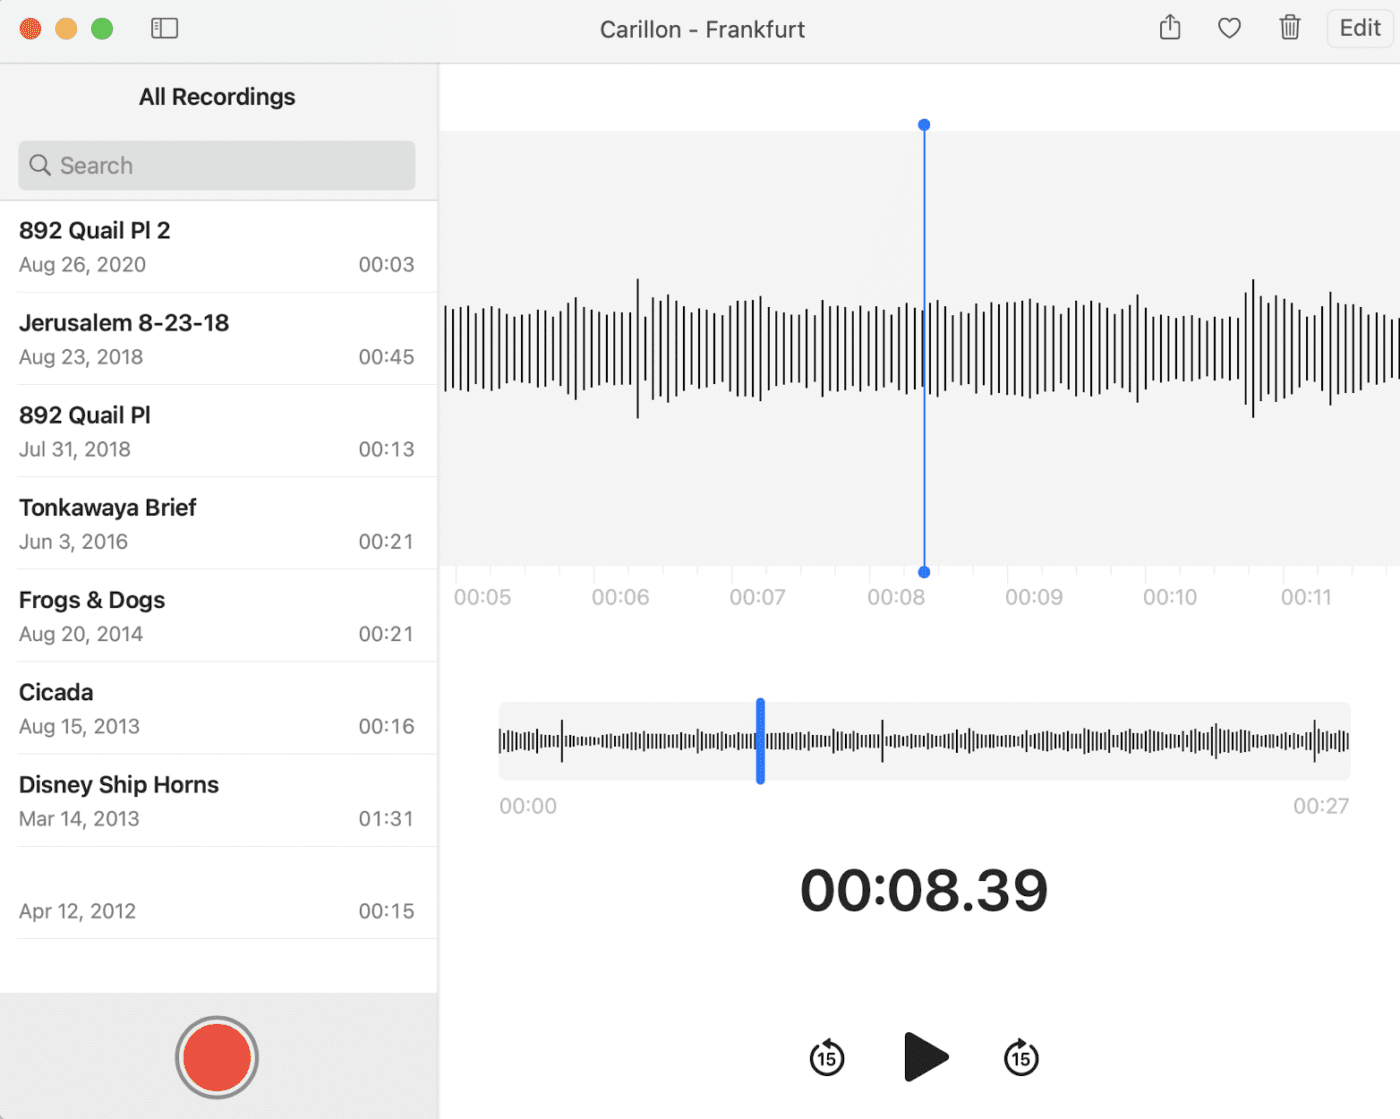
For editing Voice Memos, I prefer the Mac interface – it’s just more precise than that on the iPhone or iPad. Recorded audio can be trimmed, replaced, enhanced (to reduce background noise and reverb), duplicated, and renamed.
With a click of the big red button, a new recording starts automatically on your Mac. More details on Voice Memos for Mac are available on the Apple Support website.
6. Grapher
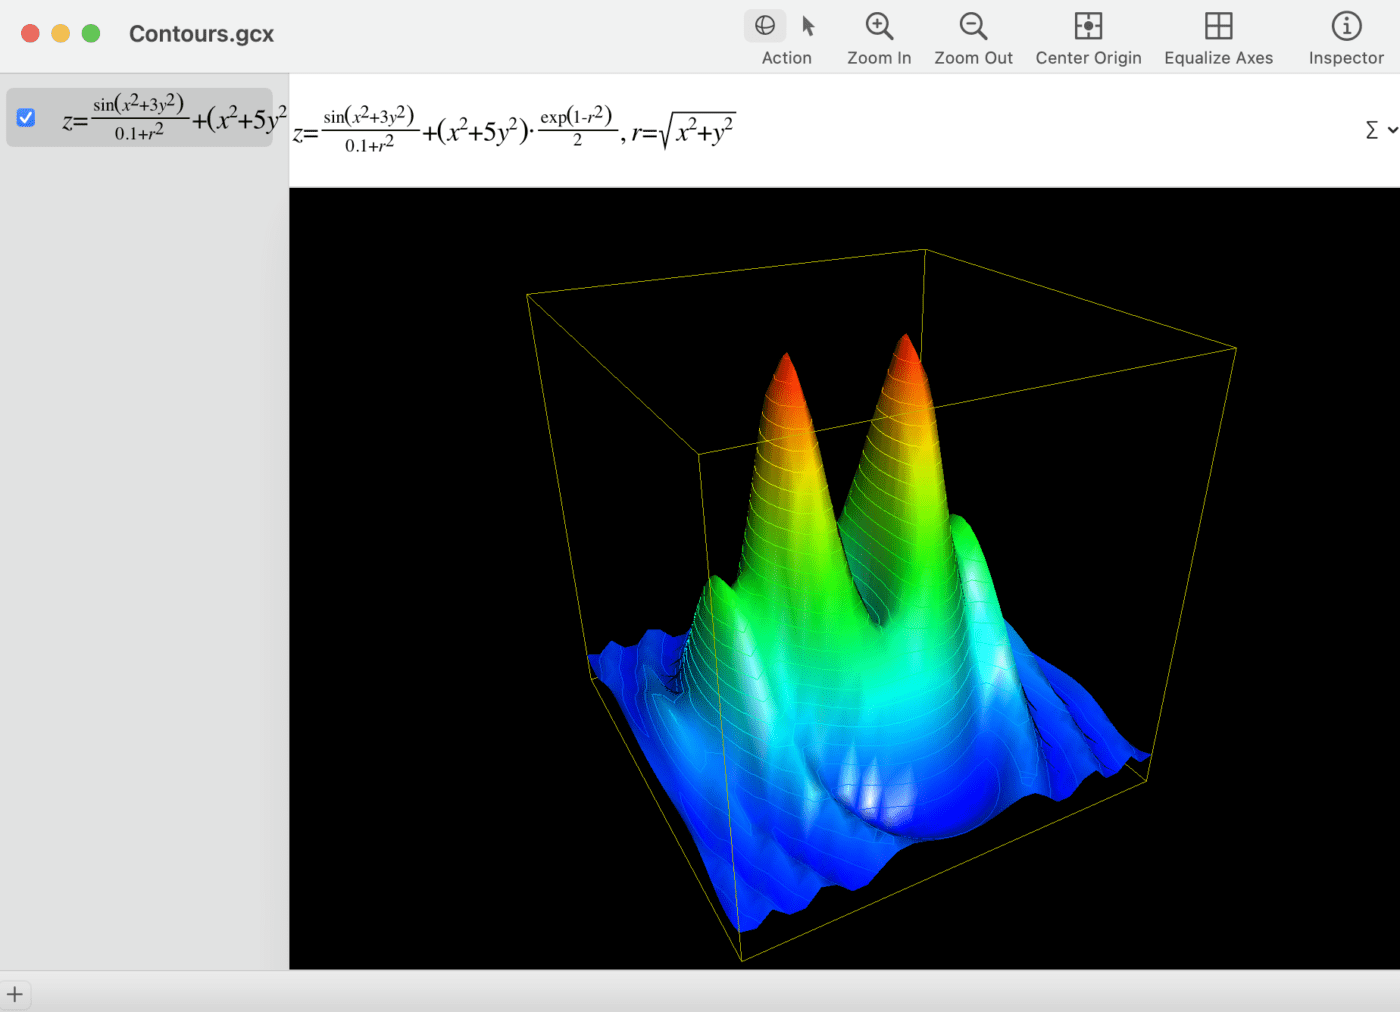
Oh, what I would have done to have this app back in engineering school in the 1970s! Grapher is a graphing calculator found in “Applications > Utilities.” It draws 2D and 3D charts based on equations entered into the Grapher editor.
Equations are easily entered by adding an element. There’s an “Add Elements” pop-up menu for general elements like exponentiation, roots, and absolute values, operators, Greek letters, and symbols. The equation palette makes it relatively easy to enter complex equations.
I won’t go into details about everything Grapher can do, but it’s fun and instructive to launch the app, then view some of the items under the Example menu. The animated toroid, contours, and toroid knot examples are really visually interesting:
As usual with these free and little known Mac apps, Apple has a support article providing details on Grapher.
There you go! Six apps that can be fun, helpful, or educational… and you didn’t have to spend a dime on them. The examples in this article are for macOS Big Sur, but most of the apps have been available for earlier versions of macOS and OS X as well.


Your CPU does not have 16 cores – it has 8 cores, 16 threads. ;) But, that’s not why I’m writing. Before anyone believes the color picker always shows accurate RGB values, I’m about to rain on your parade. If you open Monitors in Control Panel, then select the Color tab, changing your Display Profile will change the RGB values the Digital Color Meter reads. It’s not reading actual RGB pixels – it’s reading adjusted RGB values. Even setting your monitor to sRGB, and the Digital Color Picker to sRGB, the values are wrong, especially in colors with brighter reds.