Admittedly, I’m somewhat of a stats junkie. I’m not a statistician, nor am I an avid sports aficionado. But when it comes to checking in on my Mac’s performance, I like to know, in quantifiable terms, how hard I’m pushing my Macs.
System monitoring utilities are not new on the Mac. They have been around, in some form or fashion, since the heady days of classic MacOS. (Longtime Mac users may remember Memory Map, by SoftPlus, which was released in 1986.)
Thanks to its Unix underpinnings, there is no shortage of modern Mac system monitoring tools. Apple includes Activity Monitor with every copy of macOS. And while it can provide the user with a host of metrics, such as CPU and system memory usage or disk and network activity, you have to keep the application open (or in your Dock) to see it.

Stats, on the other hand, lives in your Mac’s menu bar. Written by Serhiy Mytrovtsiy, Stats (currently at version 2.9.15 at the time of this writing) is a free-to-use program that works on Macs running macOS Catalina (10.15) or later. Per its MIT licensing, users can freely deploy Stats for both commercial and private usage. (The developer kindly accepts donations via Ko-Fi and Paypal.)
Stats can monitor a range of your Mac’s activities, including:
- CPU utilization
- GPU utilization
- Memory usage
- Disk utilization
- Network usage
- Battery level
- Fan control
- Sensor info (Power, Voltage, and Temperature)
- Bluetooth devices
- Multiple Time Zone clock
Why would you need a program like Stats? Everyone’s needs are different. I use Stats to check the health of my Mac, for potential troubleshooting purposes. If my Mac mini appears to be running really slow, I can quickly check its RAM utilization to see which application is taking up too much space.
Users can install Stats by visiting the GitHub link here and then clicking to download the Stats.dmg link under Assets. (Or you can just click here to download the DMG file from GitHub.) You can also install via the Terminal (using Homebrew). (Despite its nerdy premise, you do not need to be a nerd to install Stats.)
When launching Stats for the first time, you’ll see the program take residence in your Mac’s menu bar.
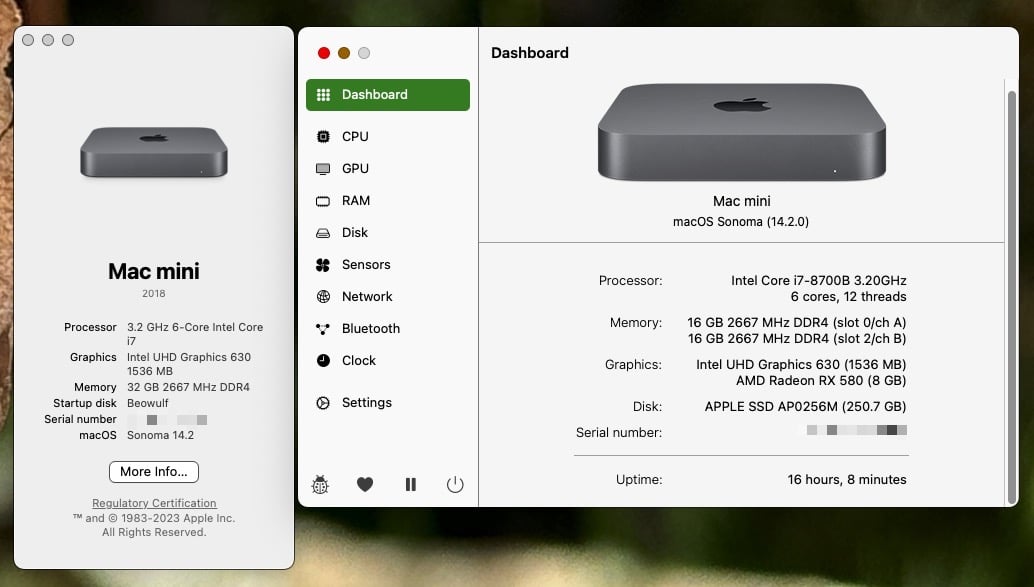
Stat’s Dashboard includes Mac make, RAM and storage specs, model number, serial number, and which version of macOS is running. This is similar to the “About this Mac” dialog, but Stats goes a bit deeper by also including uptime, core count and threads, and (if you’re rocking an Apple silicon Mac) the total number of performance and efficiency cores.
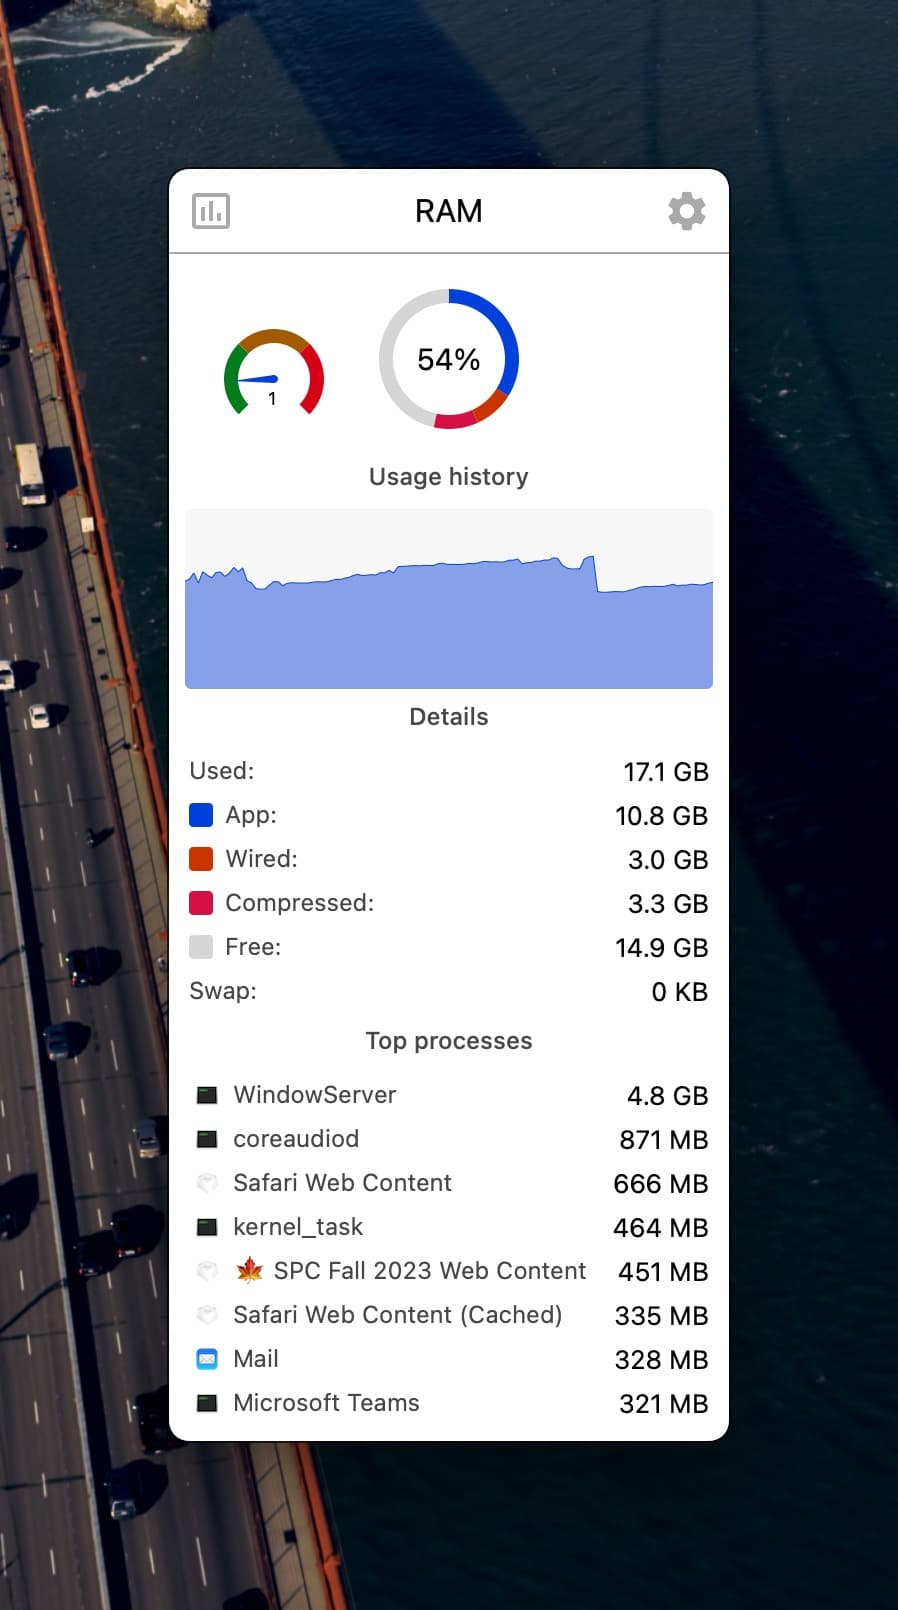
Stat’s biggest strength is its use of clear, colorful visuals to convey your Mac’s system performance. For example, when examining your Mac’s RAM utilization, Stats shows the amount of RAM currently in use, how RAM usage is allocated on your Mac (wired, compressed, free, etc.), as well as the top processes that are consuming the most RAM. You can easily kill processes from within Stats by first clicking on the icon next to the process. This will replace the icon with a small “X”, which you can click to clobber the process once and for all.
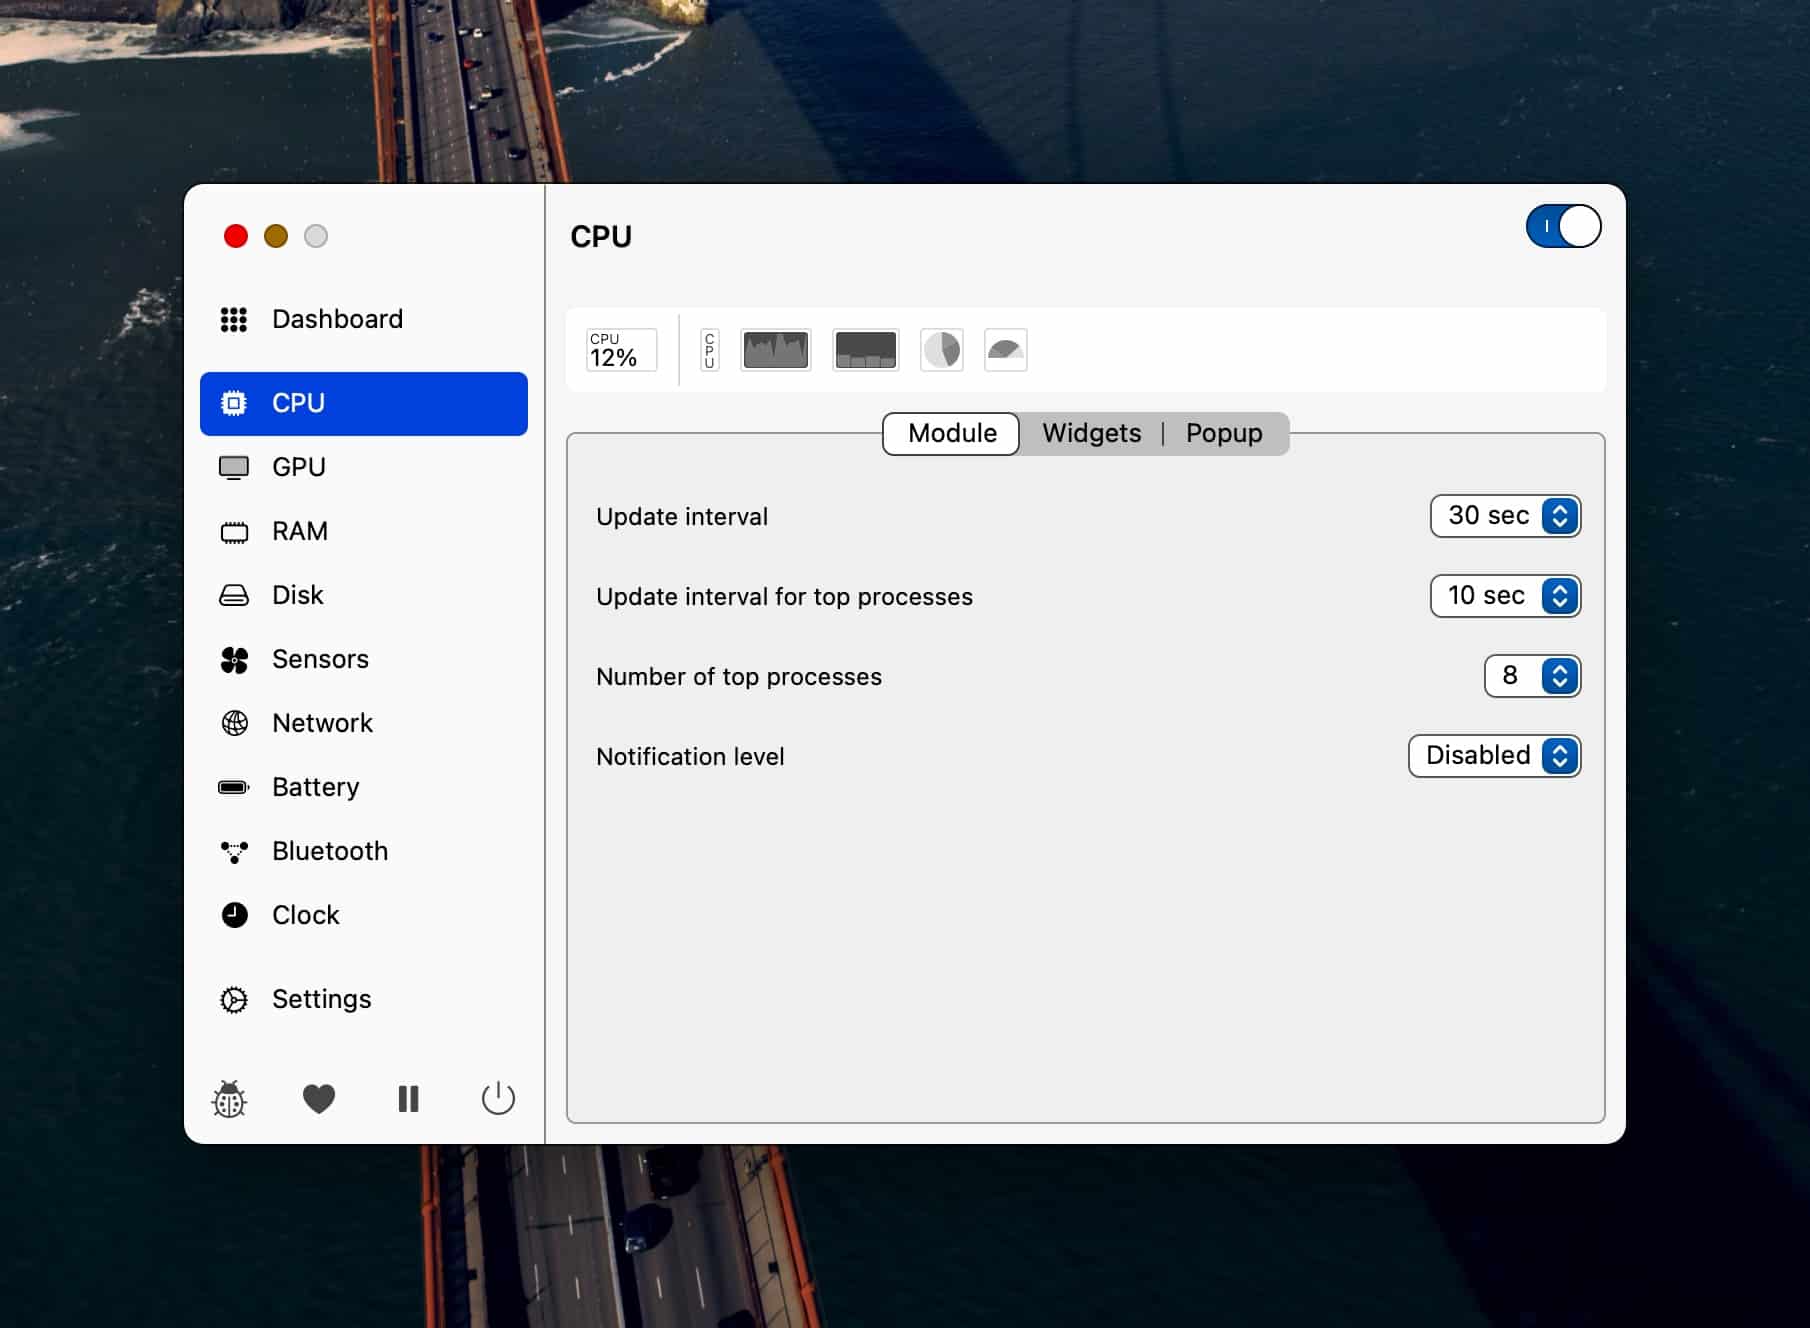
Fiddlers rejoice! You can customize nearly every facet of Stats to your heart’s content. For example, you can change the menubar icons for Disk to display the relevant information as either a percentage of free space, a pie chart, or a numerical entry showing Full vs Used storage space. You can also customize a menu item’s color. Timing intervals (i.e. to poll a disk periodically) can be user-specified. As a distant early warning, you can optionally have Stats notify you when the amount of used storage hits specific threshold.
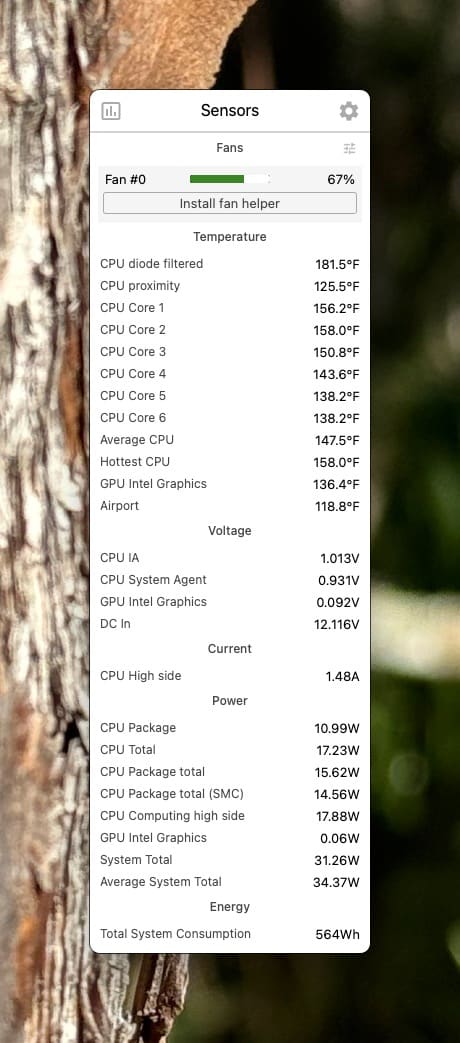
In the Sensors section, you can monitor your Mac’s fan speed (either as a percentage or RPM value), CPU temperatures (for each core), and even total energy consumption.
Stats provides a wealth of system monitoring tools for your Mac. It boasts a polished UI and comes with extensive customization options that are sure to please even the most demanding power user. Best of all, it’s free to use. And that’s one stat even I can’t argue with.


