
Curiosity gets the best of me, especially when I’m pushing my Mac to its limits. How much RAM is being used? Is memory bandwidth becoming a bottleneck during my latest Premiere Pro render? Which process is consuming the most CPU?
Questions like these can be answered — at least in part — by Activity Monitor, which comes with every Mac. But while Activity Monitor is an excellent troubleshooting tool, it doesn’t expose everything that’s happening inside an Apple Silicon chip.
That’s where SiliconScope comes in.
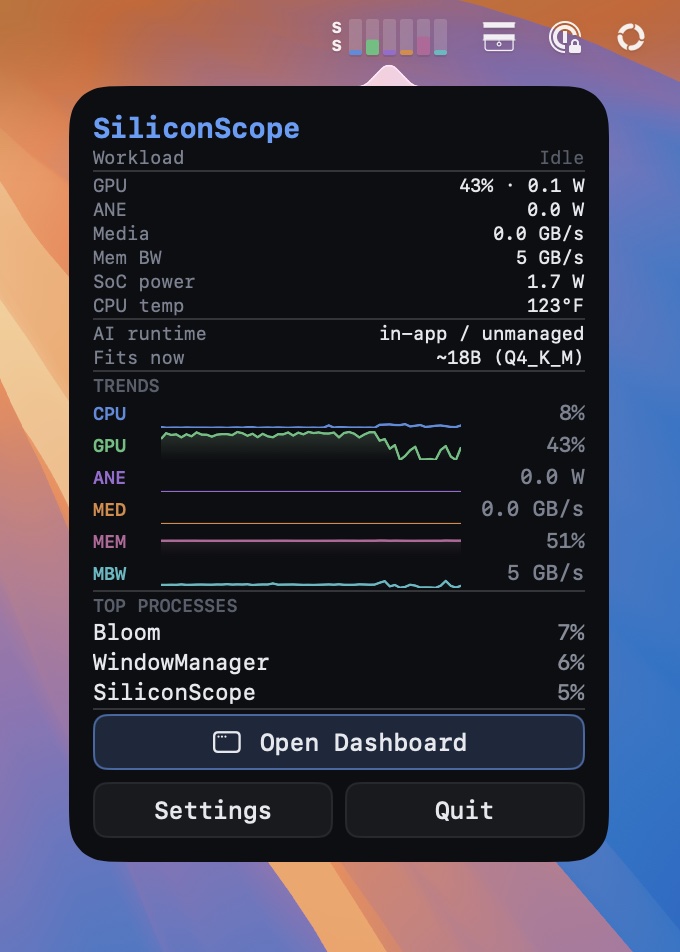
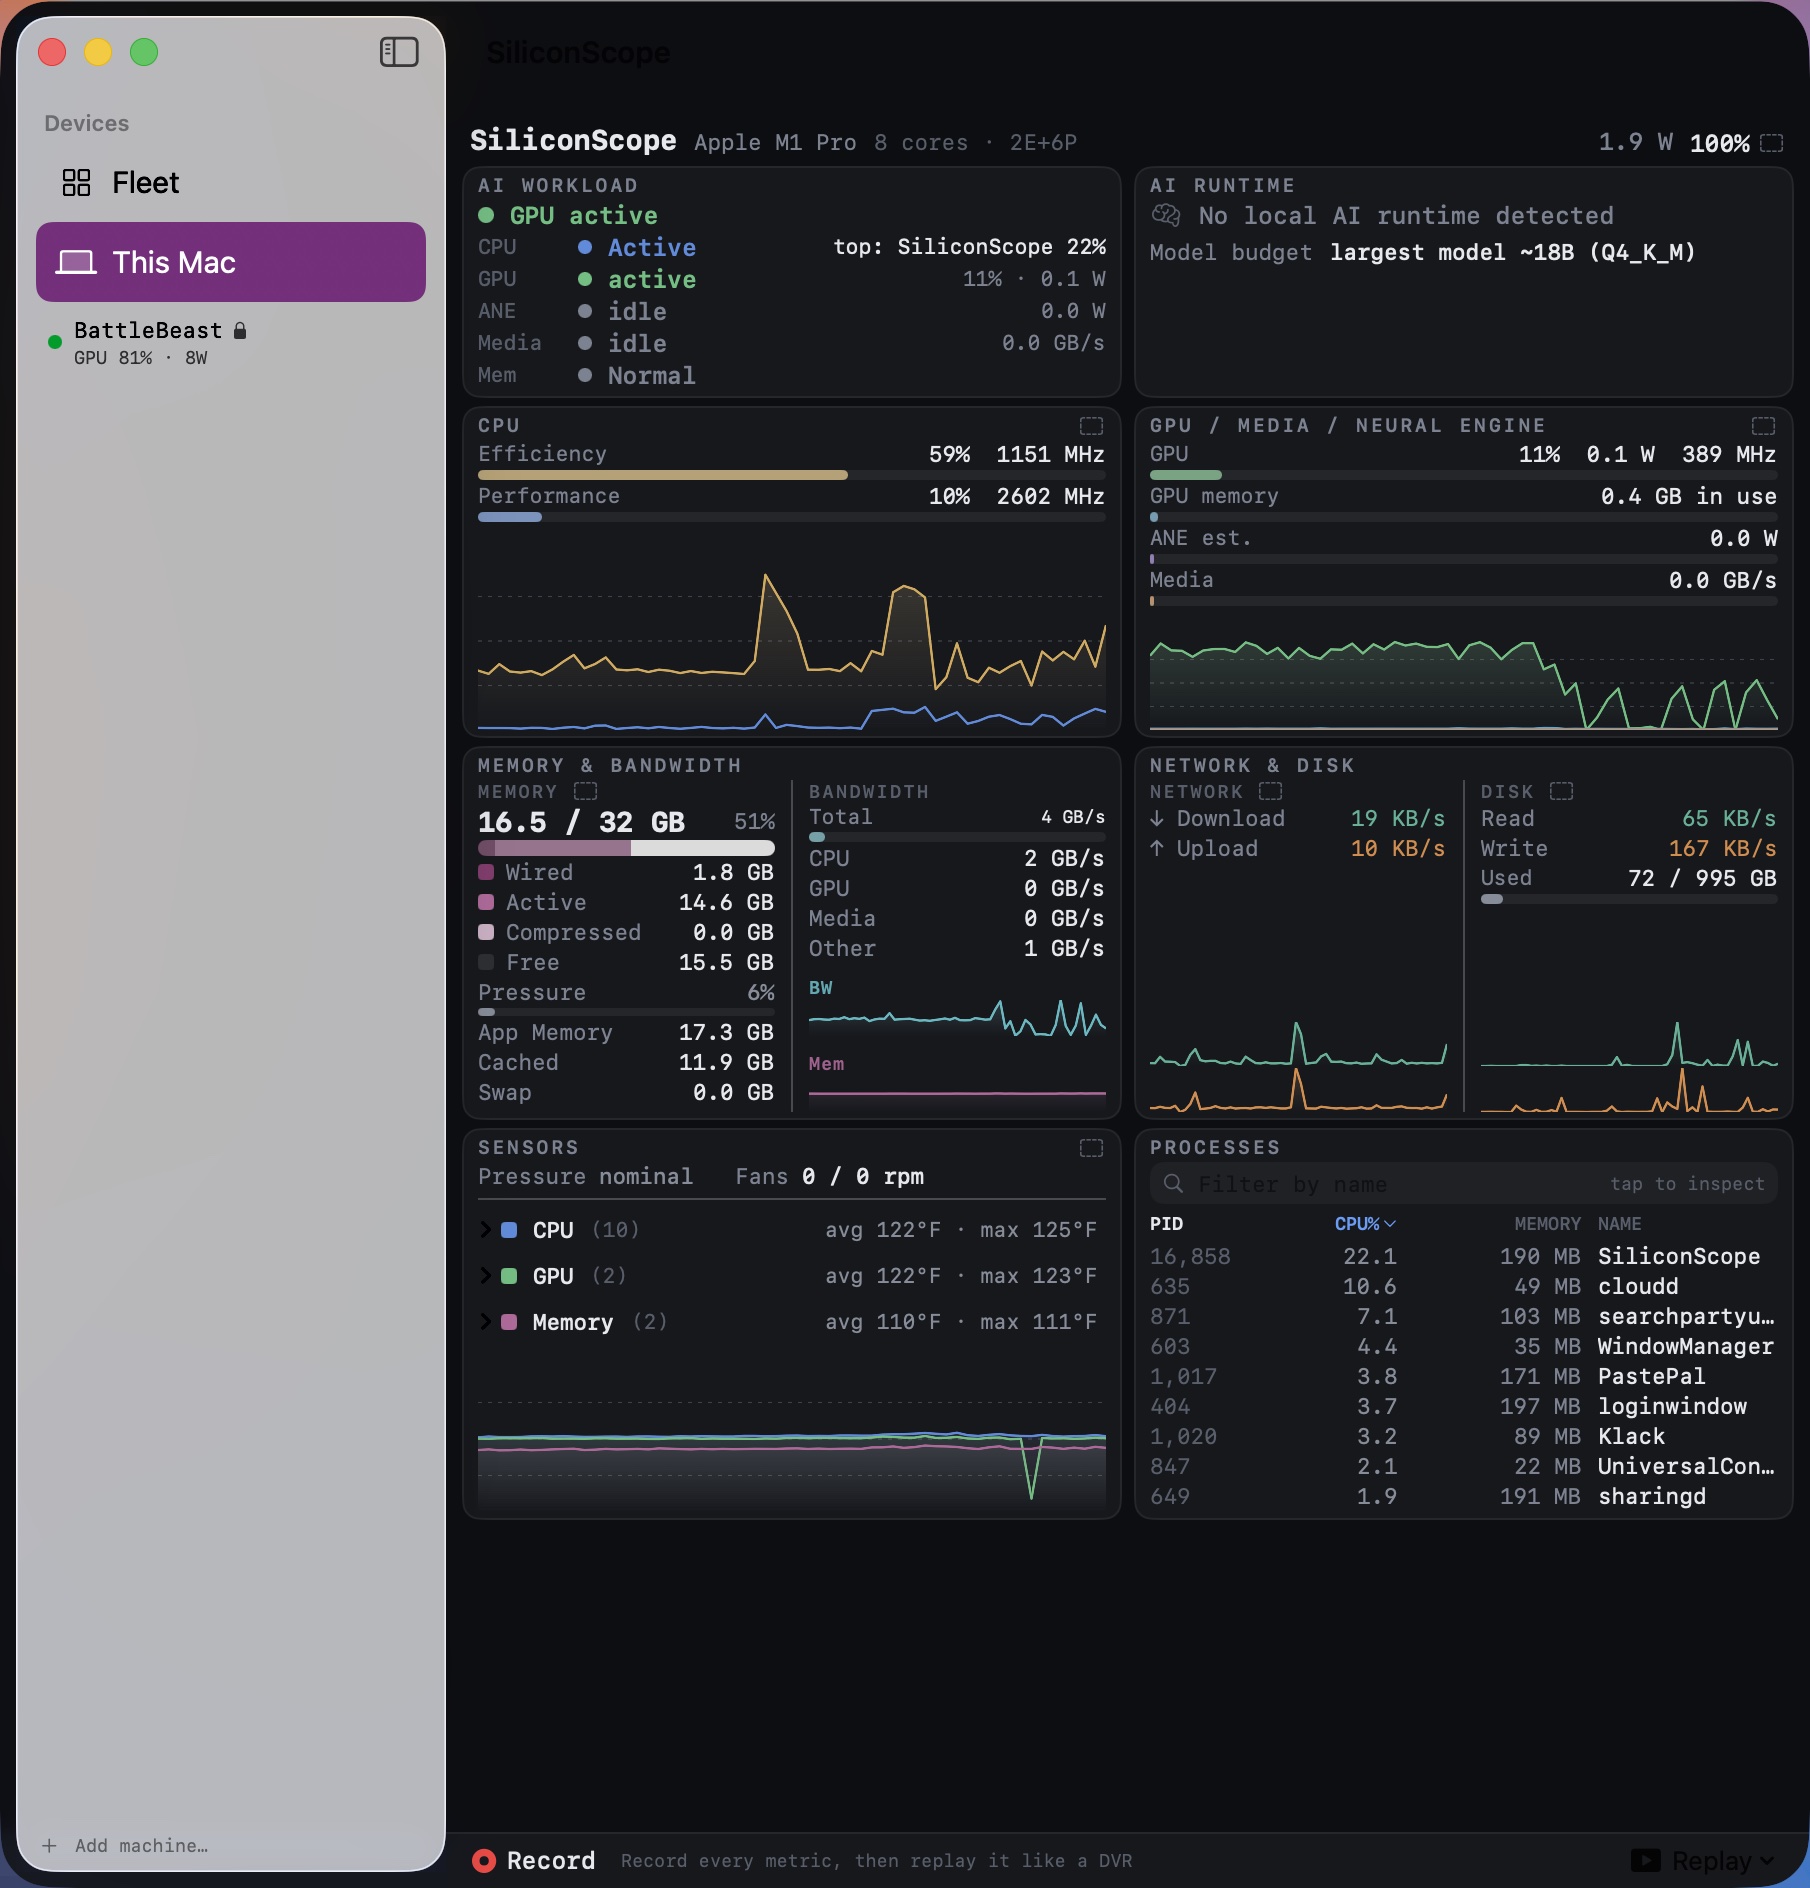
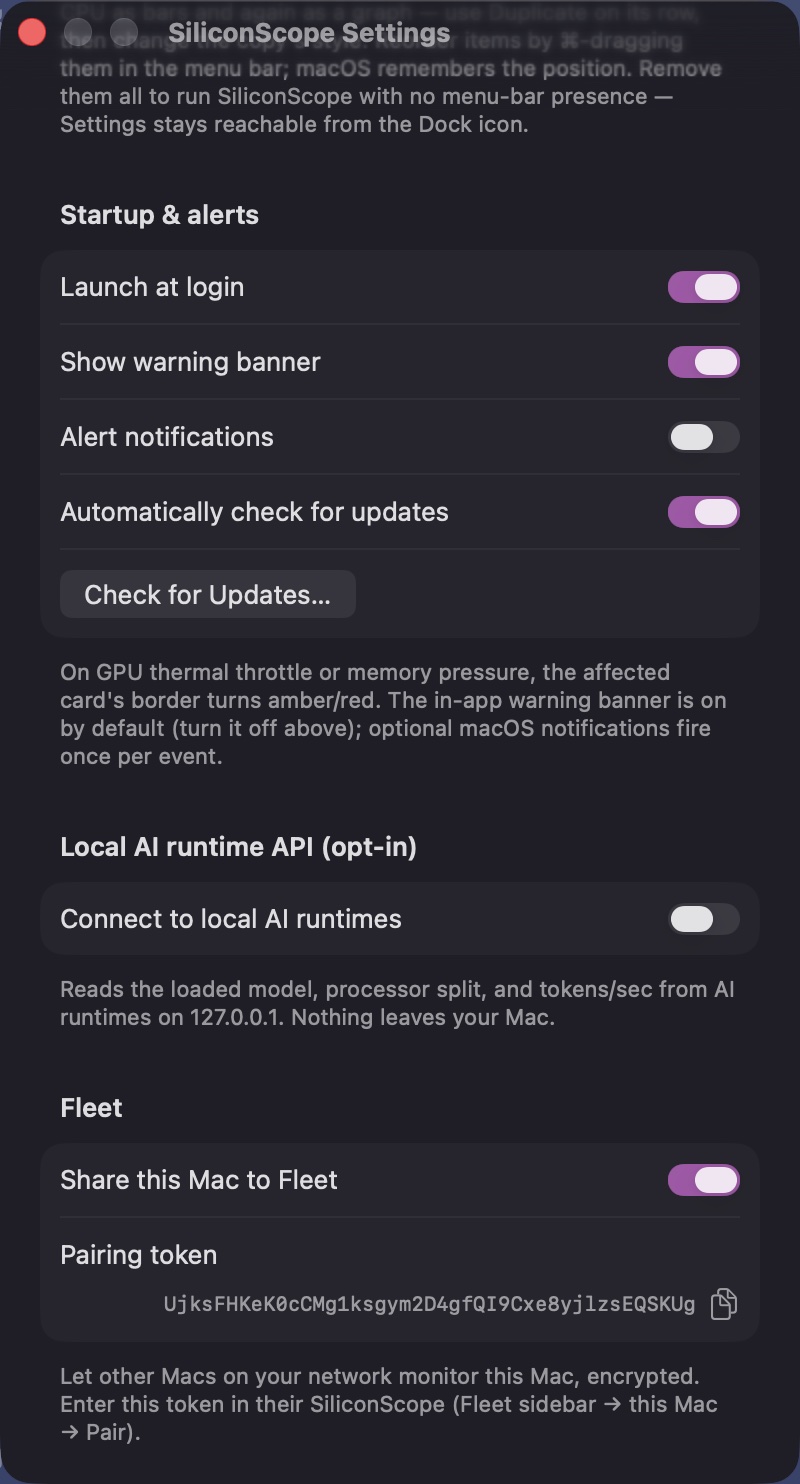
SiliconScope lives in your Mac’s menu bar, though it can also be displayed as a standalone dashboard. Like Activity Monitor, it tracks CPU, memory, storage, network, and GPU utilization. But it goes much further, providing insight into unified memory bandwidth, battery health, sensor temperatures, AI workloads, and usage of both the Media Engine and Apple Neural Engine (ANE).
The Media Engine is dedicated hardware built into Apple Silicon for encoding and decoding video, while the Apple Neural Engine accelerates machine learning and AI tasks. Offloading these jobs to specialized hardware allows them to run faster while consuming less power than if the CPU handled them alone.
SiliconScope is compact and efficient, both in terms of its CPU and memory footprint and its thoughtfully designed interface. Information is neatly categorized, with color coding and subtle dividers that make it easy to find what you’re looking for.
The combined menu bar view lets you monitor your Mac’s workload at a glance. Live graphs and numerical readouts show CPU, GPU, ANE, Media Engine, memory, and memory bandwidth utilization, along with your top three running processes. Power consumption is broken down by GPU, ANE, Media Engine, and SoC (System on a Chip), providing a much more granular view of what’s happening inside your Mac.
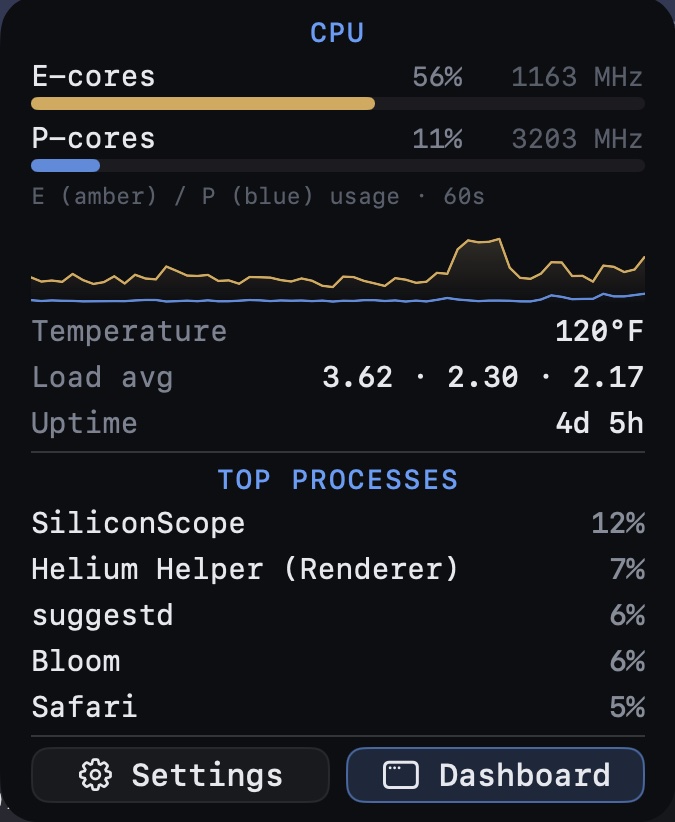
The standalone dashboard takes advantage of the additional screen space to display even more information. Better yet, individual monitoring panels can be pinned to your menu bar. If you only care about CPU utilization, for example, simply pin that panel and it becomes its own dedicated menu bar item.
SiliconScope includes two features that I haven’t seen in other Mac monitoring utilities.
The first is performance capture. SiliconScope can record your Mac’s performance metrics in real time and replay them later for analysis. That makes it especially useful for developers, power users, and anyone trying to troubleshoot intermittent performance problems.
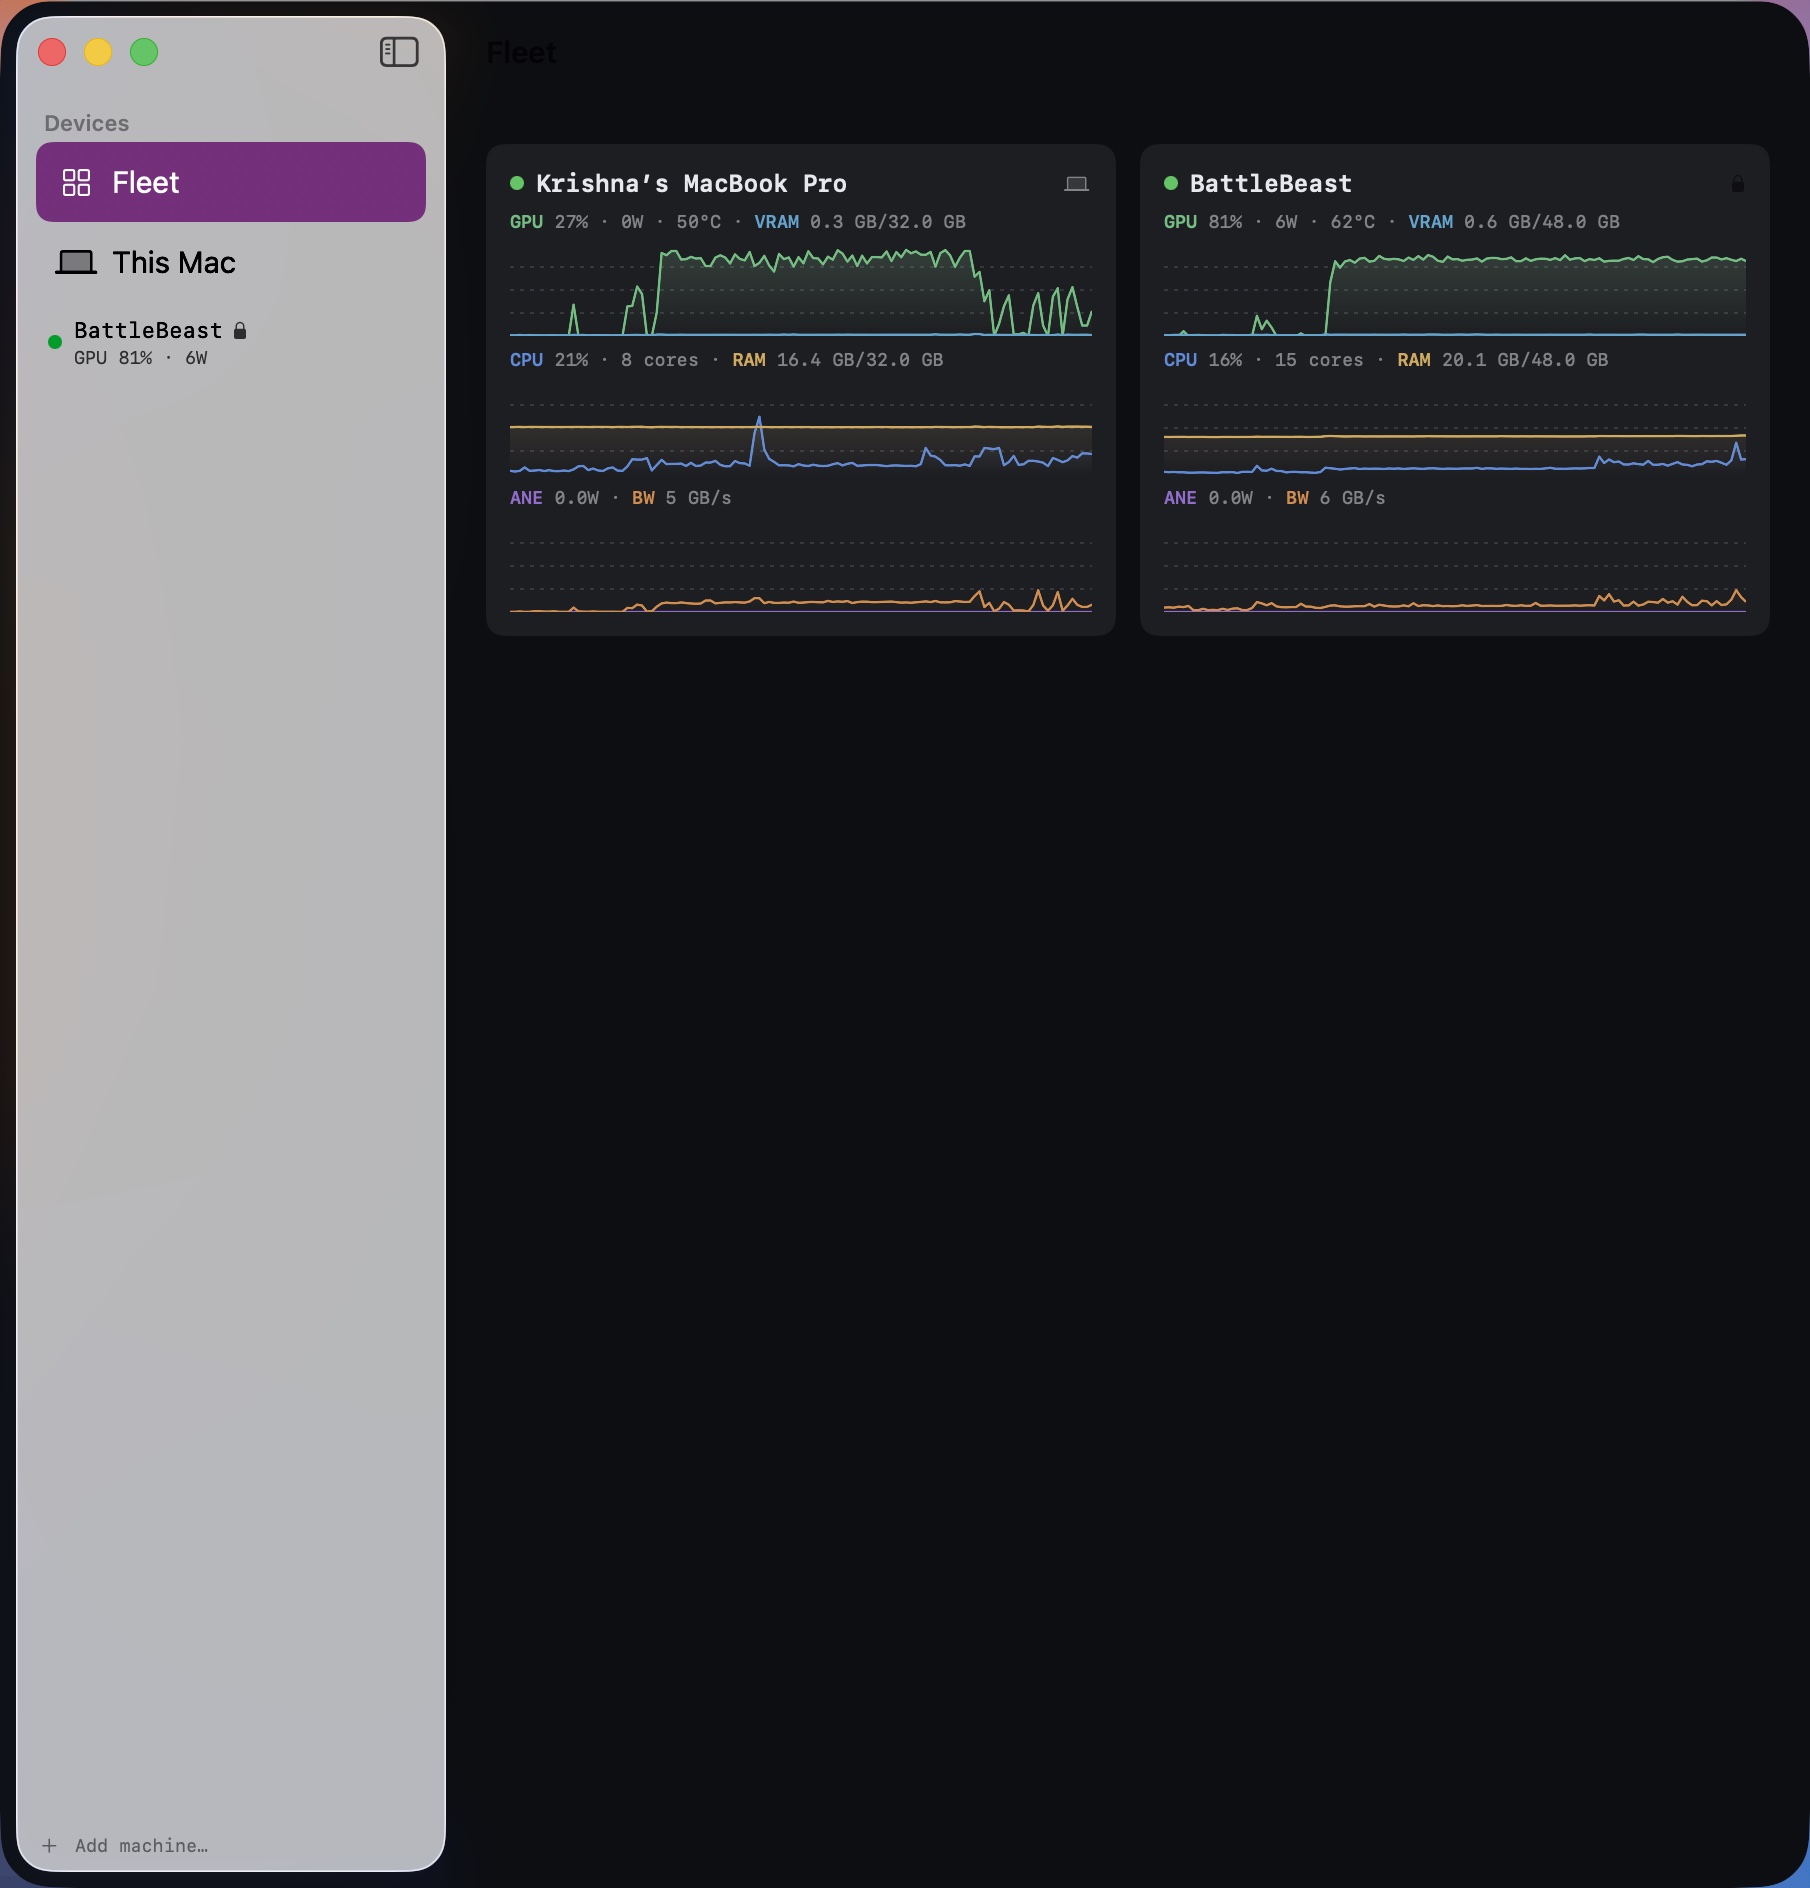
The second is fleet monitoring. Install SiliconScope on multiple Macs — or even Linux systems — and you can monitor each machine’s performance from a single dashboard. I can easily see this being useful for developers managing multiple systems or organizations running Mac server farms.
SiliconScope is free, open source, and runs on macOS 14 or later. More importantly, it’s designed specifically for Apple Silicon, exposing performance data that simply isn’t available in many other monitoring utilities.
My only real criticism is that the default type size is a bit too small for my eyes. Fortunately, that’s easily fixed by increasing the font size in the preferences.
SiliconScope certainly satisfied my curiosity.